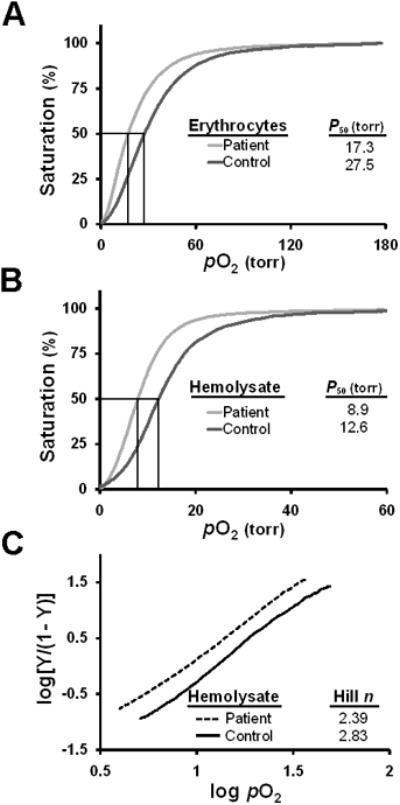
Figure 2. O2-binding properties of Hb Baden.

(A, B) Oxygen equilibrium curves. Tracings for intact erythrocytes (panel A) and clarified hemolysate (panel B) were generated for the propositus (black) and a normal donor control (grey). A vertical line indicates the P50 value for each sample. (C) Hill plots of clarified hemolysates. Hill plots of intact erythrocytes from the propositus (black) and a normal control donor (gray) are illustrated. Values of the best-fit lines, determined by linear regression analyses, are indicated.
