Figure 4.
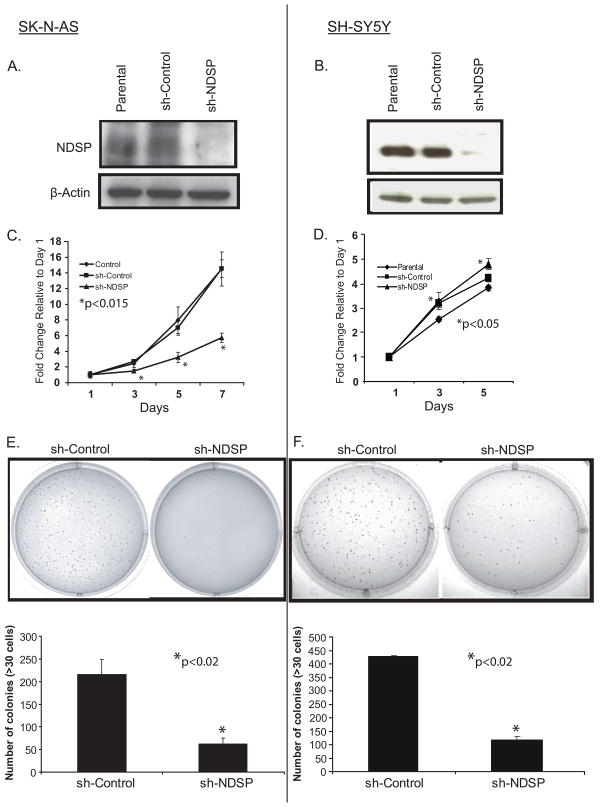
Inhibiting NDSP expression results in a proliferation defect. SK-N-AS and SH-SY5Y cell lines were transduced with the sh-Control and sh-NDSP constructs. After transduction for 48 hours, cells were selected with puromycin and grown to confluence. A and B, NDSP protein levels were analyzed in the parental, sh-Control, and sh-NDSP cell lines by immunoblotting for NDSP with the anti-NDSP-Ab1. Immunoblotting for β-actin served as a loading control. C and D, The SK-N-AS and SH-SY5Y parental, sh-Control, and sh-NDSP cell lines were plated in 96-well plates at 1 × 10³ cells/well. The CCK-8 assay was used to quantify cellular proliferation relative to Day 1 absorbance measured at 450nm. These experiments were performed with six replicates and reported as the mean with standard deviations. Student's T-test was used to determine statistical significance with a p-value < 0.05 considered statistically significant. *Indicates statistical significance comparing sh-NDSP to parental and sh-Control (C) and sh-NDSP to parental (D). E and F, SK-N-AS and SH-SY5Y sh-Control and sh-NDSP stable transduced cell lines were plated in 0.3% agarose/DMEM media on top of a 0.5% agarose/DMEM layer. After 14 days of growth, colonies were stained with MTT and colonies >30 cells were counted. These experiments were performed in triplicate and reported as the mean with standard deviations. Student's T-test was used to determine statistical significance with a p-value < 0.05 considered statistically significant. *Indicates statistical significance comparing sh-NDSP to sh-Control.

