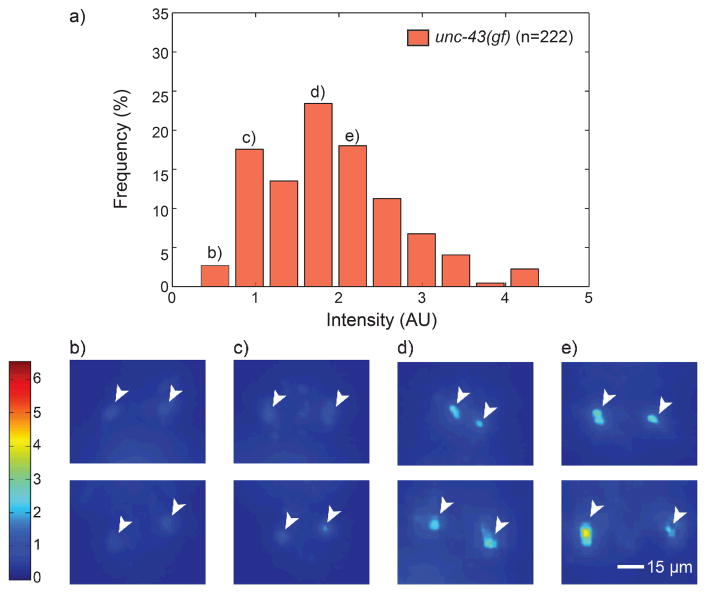
Fig. 3.
Stochasticity in gene expressions in a genetically identical population. (a) Probability histogram of tph-1 expression levels in single mutant (unc-43). The n value represents number of worms imaged. (b–e) Representative images of tph-1 expressions in ADF neurons in unc-43(gf), which correlate with each quantified bar in histogram (a). All fluorescent images are revised as a heat map for clarity. The color bar on the left represents the average intensity of target neurons, ADFL/R, which correlates with the expression levels of tph-1.

