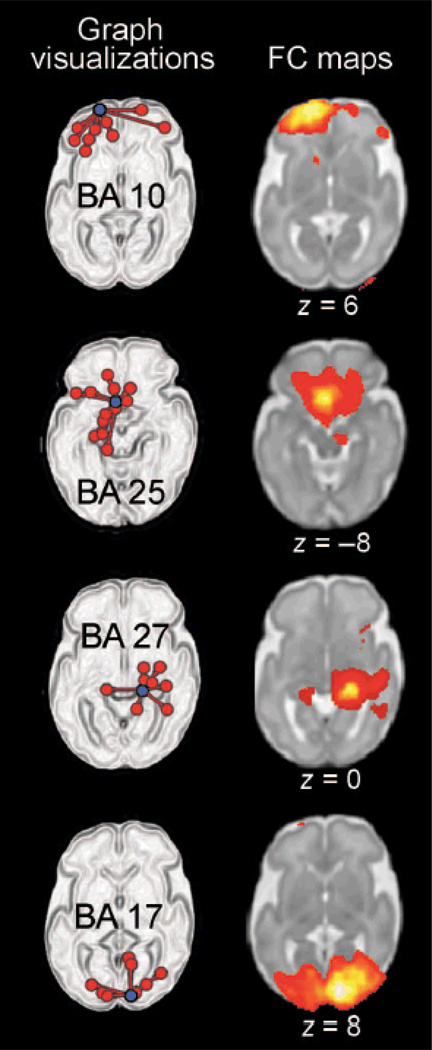
Figure 1.
Graph visualizations and FC maps of neural connectivity in a group of 25 fetuses. On the left, graph visualization depict a single “seed” region of interest (ROI) (in purple) along with all areas significantly functionally connected to that seed region (P < 0.05, corrected for multiple comparisons). The Brodmann’s area (BA) from which exemplar seeds are drawn is indicated on these graph depictions. FC maps on the right demonstrate the strength of connectivity (P < 0.001) from the same seed region that is depicted to the left but do so within a representative slice. Slice position is given below each FC map, where z = position in axial plane using Montreal Neurological Institute (MNI) coordinate space.

