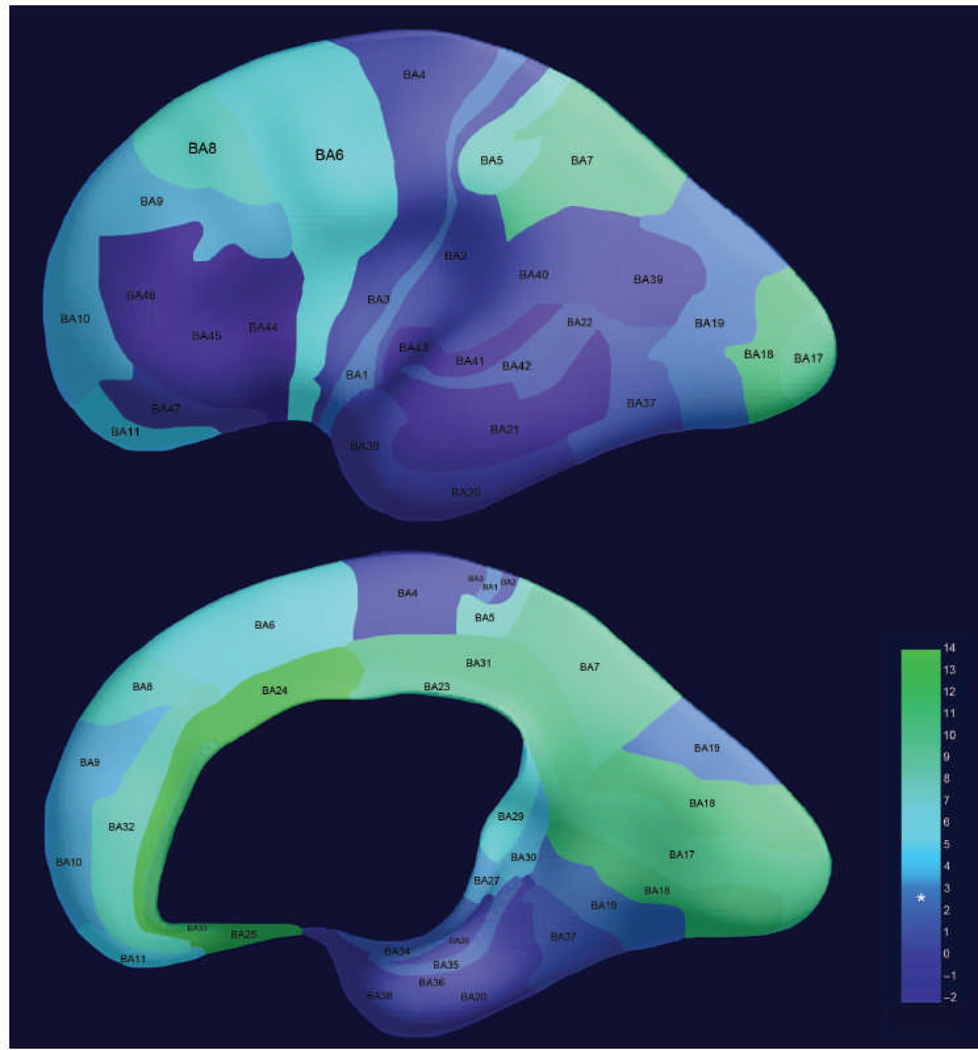
Figure 2.
Regional differences in bilateral FC in 25 fetuses. Strength of right-left connectivity across the group is depicted as a color gradient with higher values corresponding to stronger FC. Asterisk is used to denote the statistical level (t = 2.85) at which measured FC exceeds a significance level of P (FDR) < 0.05. Colors are projected onto a three-dimensional (3D) rendering of the brain of a 30-week-old fetus. The lateral surface of the brain is shown in the top image, whereas the medial surface is shown in the bottom image.

