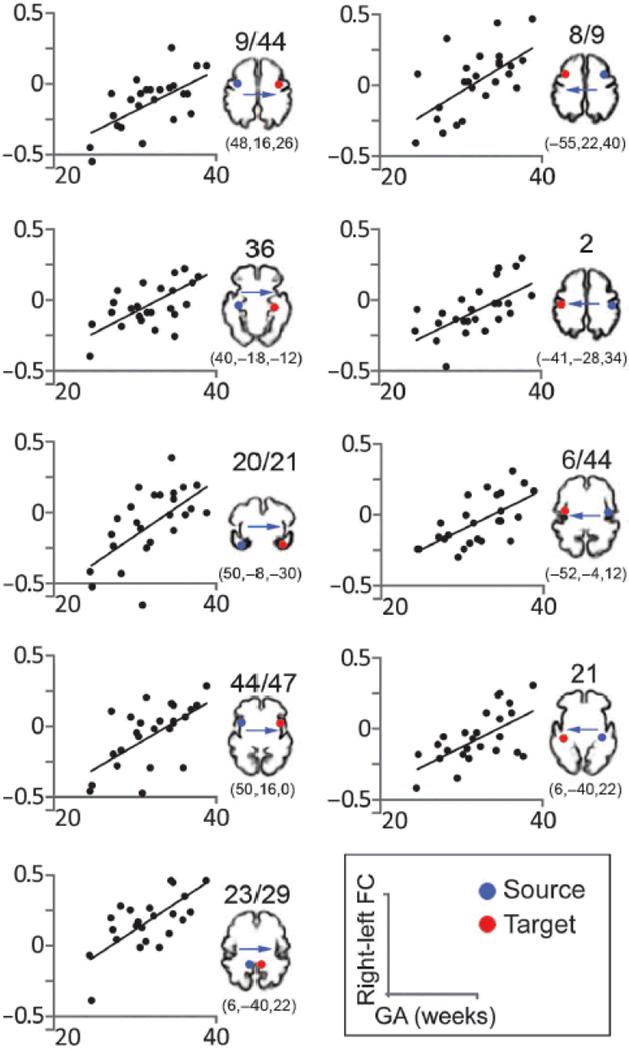
Figure 4.
Association between strength of bilateral FC and GA of fetuses. Scatter plots depict significant age effects across representative cortical areas. All correlation coefficients r are > 0.6 (Pearson; two-tailed) and P values are ≤ 0.001. Blue dots indicate sources used in SCA (seed) analyses. Red dots indicate approximate contralateral target areas where significant age-related increases in FC were observed. Target FC values and fetal age comprise the scatter plot data points. The precise FC coordinates of the target areas are included below cortical templates of a 32-week-old fetus, which are provided for visual reference. Bas are indicated above the reference images.

