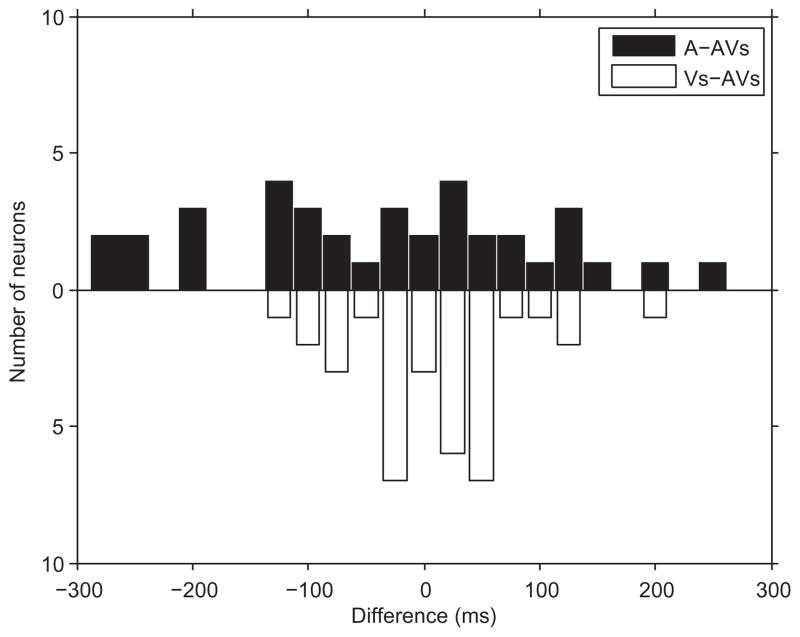
Fig. 4.
The bar graph portrays the number of cells which had an onset latency to the auditory stimulus (A) that was more or less than the onset response latency to the combined face–vocalization (AV) stimulus (black bars), and the number of cells which had an onset latency to the visual stimulus (V) that was more or less than the onset response latency to the combined face–vocalization (AV) stimulus (white bars). In this population of cells the auditory stimulus evoked the shortest latency in most cells and the visual stimulus elicited the longest latency.

