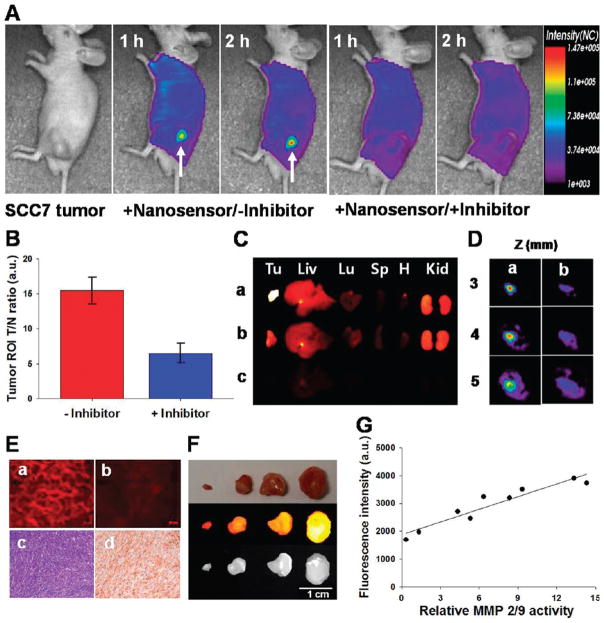
Figure 3.
(A) In vivo NIR fluorescence tomographic images of subcutaneous SCC7 tumor-bearing mice after intravenous injection of the NS with or without the inhibitor. Only tumors injected with the NS without inhibitor were clearly visualized. (B) Tumor ROI and T/N. (C) NIR fluorescence images of excised SCC7 tumor and organs (Tu: tumor; Liv: liver; Lu: lung; Sp: spleen; H: heart; Kid: kidney). NS-treated animals with (a) and without (b) the inhibitor, and saline-treated animals (c). (D) Two-dimensional slices of the tumor images from Figure 3A reconstructed in the z direction (3–5 mm). (E) a,b: NIR fluorescence microscopy of SCC7 tumors injected with NS that were left untreated (a) or treated (b) with the inhibitor. Immunohistology analysis of SCC7 tumors. c: H&E stain; d: IHC of MMP-2 protein expression in a SCC7 tumor section counterstained with primary antibody for MMP-2. (F) NIR fluorescence images of excised NS-treated SCC7 tumors from mice with different size tumors. (G) Correlation between tumor grades (total fluorescence intensity) and the relative MMP-2/9 activity of excised SCC7 tumors.

