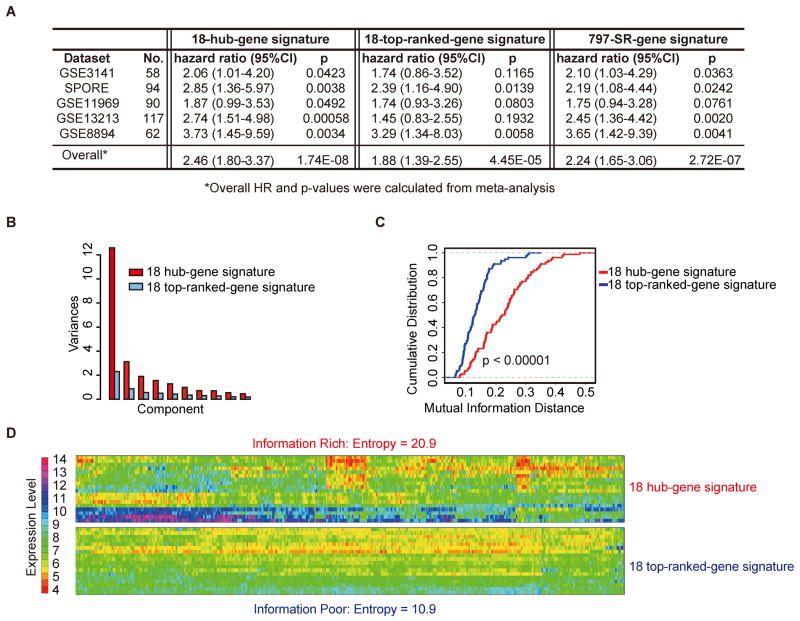
Figure 4.
Comparison of the 18-hub-gene set, 18-top-ranked-gene set and 797-SR-gene signature: (A) Summary of the prognostic performance for 18 hub-gene set, 18 top-ranked-gene set and 797-SR-gene set. The training data is the Consortium data; the validation sets include five different datasets. *Overall HR and p-values were calculated from meta-analysis. (B) Expression variation across the population in the Consortium dataset based on principal component analysis. (C) Pair-wise mutual information distance based on expression values in the Consortium dataset. (D) Entropy of expression values in the Consortium dataset.

