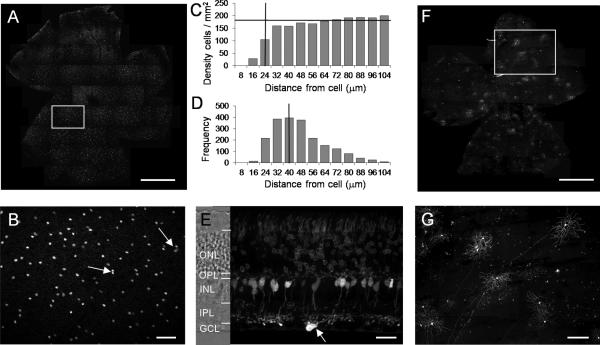
Fig. 1.
Distribution of PCP2-positive GCs in a retinal whole mount and a vertical section. A: Retinal whole-mount with tdTomato labeled GCs photographed at the GCL. White box shows region enlarged in B. B: High magnification of a retinal whole-mount viewed at the GCL. Most the PCP2-positive GC somas were evenly distributed but occasionally two or three somas were found in close proximity (shown by arrows). C: In a density recovery profile, a horizontal bar marks an average cell density (~185 cells / mm2), vertical bar indicates effective radius (~24 μm). D: Nearest neighbor analysis shows the most frequent distances between the neighboring cells (~40 μm). E: In a retinal vertical section, tdTomato fluorescence was detected in photoreceptors, bipolar cells, and a PCP2-positive GC (arrow). F: In a retinal whole mount, the virus-mediated expression of mCherry can be found in Cre-positive GCs. G: In the enlarged area from F, the somas, dendrites, and axons of the mCherry-expressing individual GCs can be clearly seen. ONL: outer nuclear layer; OPL: outer plexiform layer; INL: inner nuclear layer; IPL: inner plexiform layer; GCL: ganglion cell layer. Scale bar = 1000 μm in A and F; 100 μm in B; 25 μm in E; 200 μm in G.

