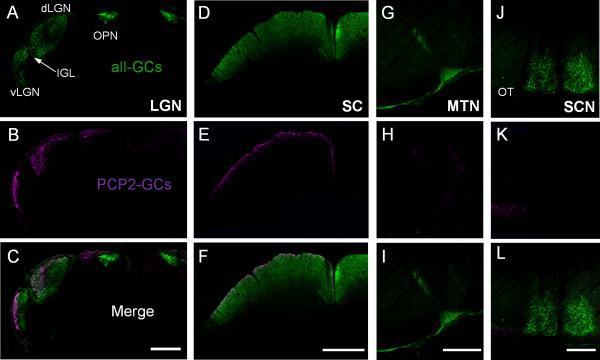
Fig. 8.
Central projection patterns of PCP2-GCs. All sections were photographed in the brain of the same mouse. The axon terminals of all GCs in both eyes were labeled by cholera toxin b subunit coupled to Alexa 488 (CTB, A, D, G, and J). Four different cross-section levels of the brain, LGN, SC, MTN, and SCN, contralateral to the eye injected with the viral vectors carrying a cre-excisable reporter gene (mCherry, B, E, H, and K) are shown. A-C: In the coronal section through the LGN, the projections of the PCP2-GCs were observed in the lateral part of the vLGN and ventro-lateral part of the dLGN. They were absent from the IGL and the OPN (C). D-F: The projections of the PCP2-GCs were located predominantly within a narrow superficial sublamina of the SC. G-I: Very weak mCherry-fluorescence was detected in the MTN. J-L: No mCherry-positive fibers were detected in the SCN region but were observed in the nearby OT. vLGN – ventral lateral geniculate nucleus; dLGN - dorsal lateral geniculate nucleus; SC – superior colliculus; IGL – intergeniculate leaflet of the lateral geniculate complex; OPN – olivary pretectal nucleus; MTN – medial terminal nucleus; SCN – suprachiasmatic nucleus; OT – optic tract. Scale bar = 450 μm in C and F; 200 μm in I and L.

