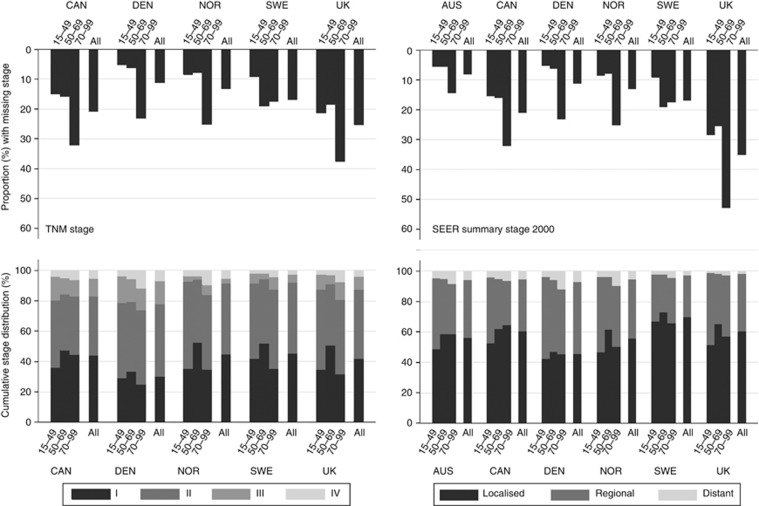
Figure 1.
Proportions of breast cancer patients with missing stage (upper figure) and cumulative stage distribution among staged patients (lower figure). Results presented by age at diagnosis and country: TNM (left) and SEER Summary Stage 2000 (right). Notes: Denmark and Norway: national data; Australia: New South Wales; Canada: British Columbia and Manitoba; Sweden: Uppsala-Örebro and Stockholm-Gotland health regions; UK (TNM analysis): Northern Ireland, Wales and the Northern and Yorkshire Cancer Registry and Information Service, Eastern Cancer Registration and Information Centre, Oxford Cancer Intelligence Unit, West Midlands Cancer Intelligence Unit in England; UK (SEER SS2000 analysis): Northern Ireland and Wales. In Denmark, we analysed women diagnosed during 2004–7.

