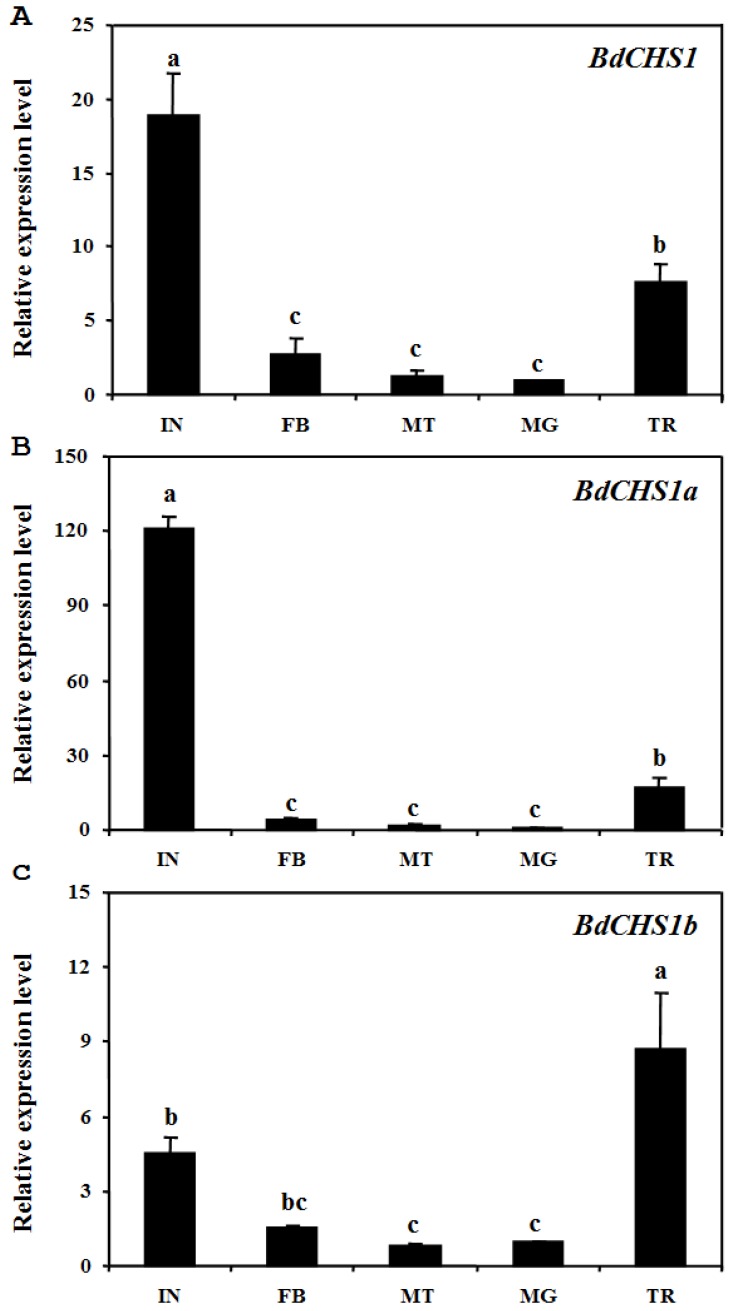
Figure 6.
Relative expression levels of BdCHS1 and its two alternative splicing exons in different tissues of Bactrocera dorsalis. Expression levels in integument (IN), trachea (TR), midgut (MG), Malpighian tubules (MT), and fat body (FB) were detected by qPCR. (A) BdCHS1; (B) BdCHS1a; (C) BdCHS1b. α-Tubulin was used as an internal reference gene. Data are means ± SE of three biological replications. The relative expression was calculated based on the value of the lowest expression which was ascribed an arbitrary value of 1. Different letters above the bars indicate significant differences among tissues (P < 0.05, t test).

