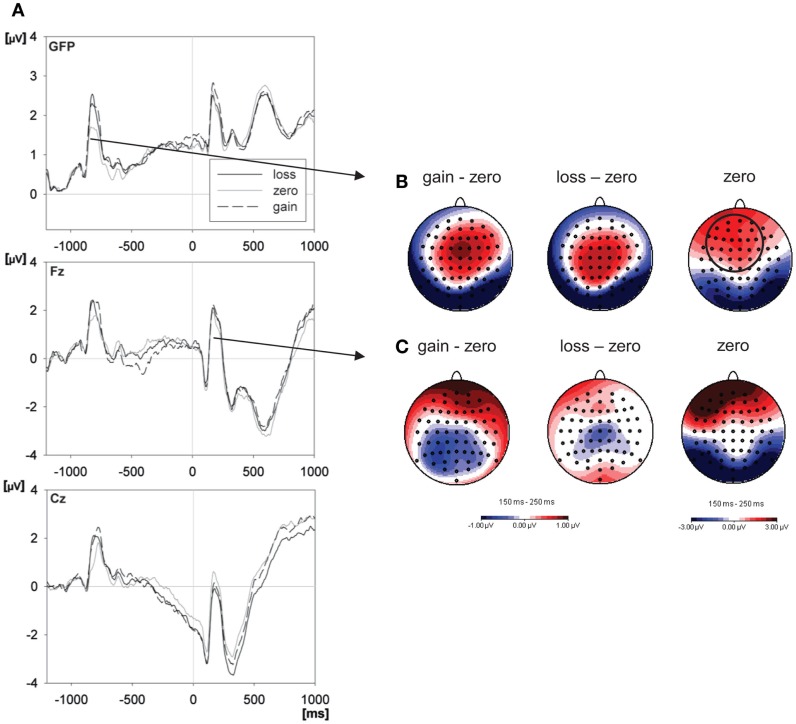
Figure 3.
Effects of reward expectancy on ERPs. (A) The left panel depicts the grand mean ERP waveforms from global field power (GFP) – which reflects the overall ERP activity across the scalp at any given moment, frontal (Fz), and central (Cz) electrodes, within the gain, loss, and zero outcome expectancy condition. The word was presented at 0 ms, the cue at −1000 ms. The right panel shows the scalp distributions (standard amplitude subtraction) of the differences between expected gain and zero outcome condition and between expected loss and zero outcome condition and, further, the distribution of ERPs in the zero outcome condition within the 150–250-ms interval after the cue (B) and after the word (C) (electrodes of the P2 peak analysis are indicated by the circle).

