Figure 2.

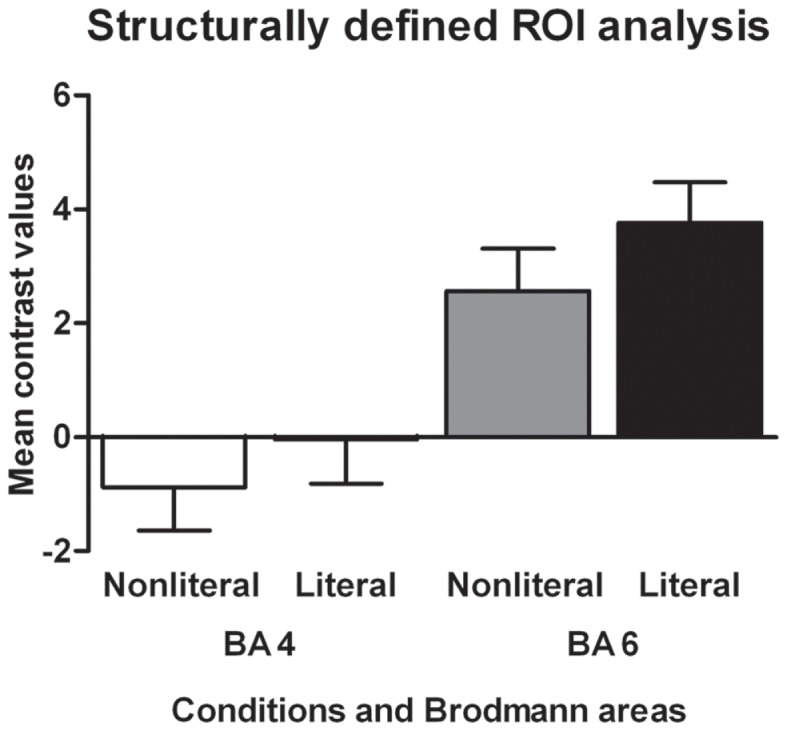
Structurally defined ROI analysis. The mean contrast values compared to an implicit baseline are shown for each Brodmann area and sentence type.

Structurally defined ROI analysis. The mean contrast values compared to an implicit baseline are shown for each Brodmann area and sentence type.