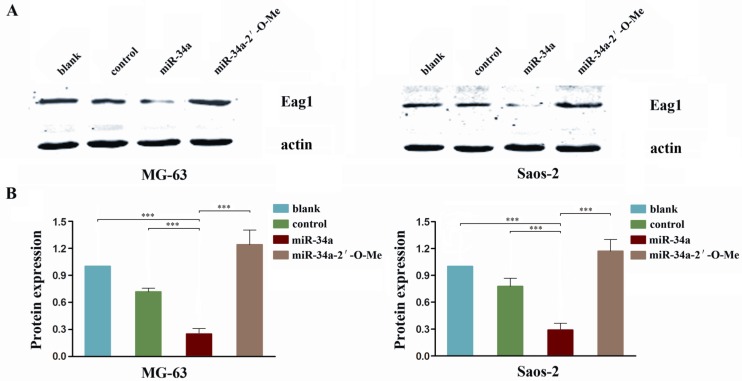
Figure 5.
miR-34a regulates Eag1 expression. A: Western blot analysis showed that the expression level of Eag1 in the miR-34a group was significantly lower than that in the blank group or control group, while the expression level of Eag1 was increased in the miR-34a-2'-O-Me group. B: Grey-value analysis of the bolts with actin as the internal reference. The results were expressed as mean ± SD (n = 3). *** P<0.001.

