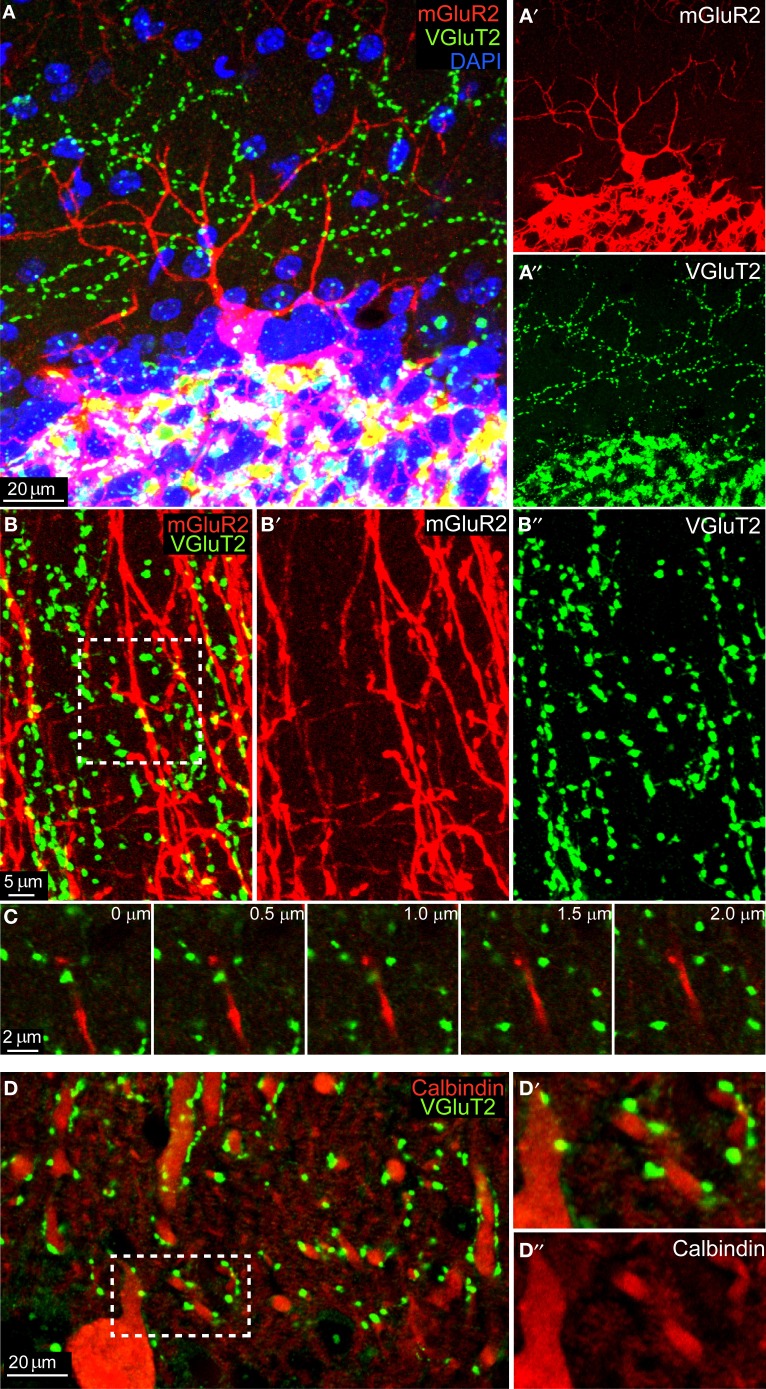
Figure 1.
No colocalization between mGluR2-marked GoC and VGlut2 in the ML. (A) Maximum intensity projection of a 20 μm-thick sagittal section of an mGlur2-stained GoC (red) located in the upper GL (identifiable through the extremely dense DAPI staining, in blue). Its dendrite ascends to the ML, where punctuate staining indicates VGlut2. The red and green channels are split and presented separately in, respectively, (A') and (A”). Note the mismatch of the two signals. (B) High-magnification of the ML in coronal section (maximum intensity projection of a 2 μm slices), with red GoC dendrites (mGluR2 positive; B') and VGlut2-marked CF endings (green; B”). Potential colocalizations are scarce, and when present appear like yellow spots (see arrow). (C) Montage in the z-plane with 0.5 μm interval between photographs of the inset indicated in (B). Note how the GoC dendrite (red) and the VGluT2 varicosity (green) lay on different planes, separated by at least 1 μm. (D) Maximum intensity projection of a 4.5 μm-thick sagittal section of Calbindin-stained PCs dendrites (red, see detail in D”) which abundantly colocalized with VGlut2 (green; D').

