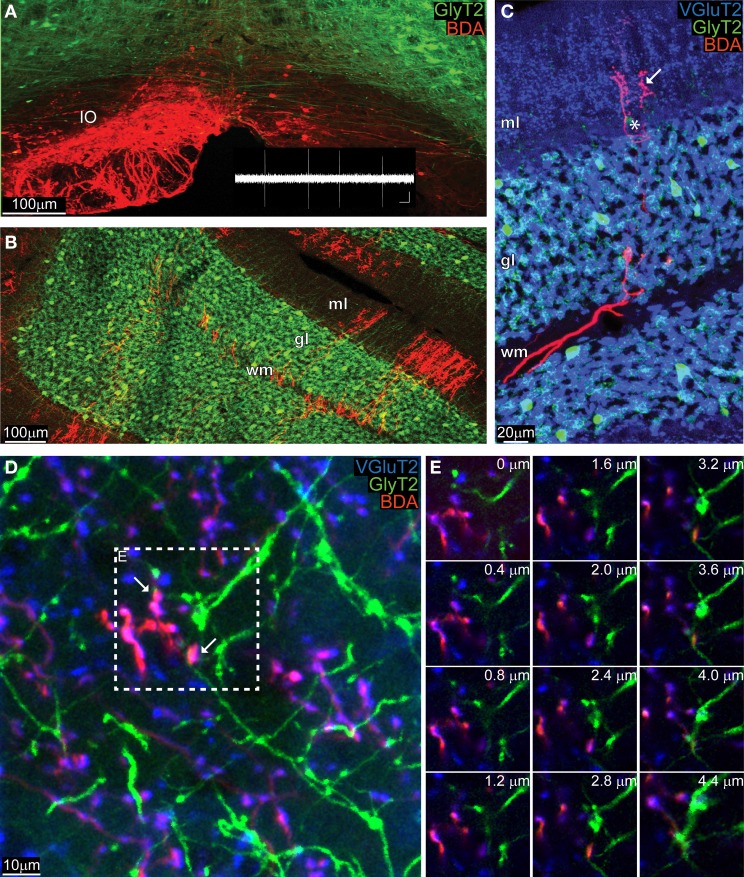
Figure 2.
Anatomically marked CFs co-stain with VGlut2 in the ML, but not with GoC dendrites. (A) Maximum intensity projection of a low magnification image (10 μm thick) of the IO of a GlyT2-EGFP mouse, in which all glycinergic neurons (GoC included) are green. The animal was unilaterally injected with BDA in the left IO, and the BDA was visualized with a red fluorochrome. The inset in white reproduces a typical olivary neuron firing pattern (scalebar: 0.5 mV, 500 ms). (B) View of the cerebellar cortex of the same GlyT2-EGFP mouse presented in (A) (maximum intensity projection of a 10 μm thick slice). The BDA along the olivary axon clearly stained CFs, which entered in the white matter (WM), passed through the GL and reached the ML. (C) Example picture (maximum intensity projection, 5 μm thick) gathered from a BDA-injected (CFs in red red) GlyT2-EGFP mouse (GoCs in green) additionally stained for the synaptic marker VGluT2 (blue). The CF in the WM and GL remained bright red, while in the ML it co-localized with VGluT2 and circled around a PC (star) and assumed a violet color (arrow). (D) Maximum intensity projection at high magnification of the ML (4.4 μm thick), with abundant double labeling BDA-VGlut2 (red and blue), but not with GlyT2 (green). Two potential triple-labelings are indicated by the arrows. (E) Montage in the z-plane of the inset presented in (D) containing the potential synapses with 0.4 μm interval between photographs. The red and blue channel appear at the same depth, but not the green one, indicating that the GoC dendrite resides in a different plane than the CF terminal.

