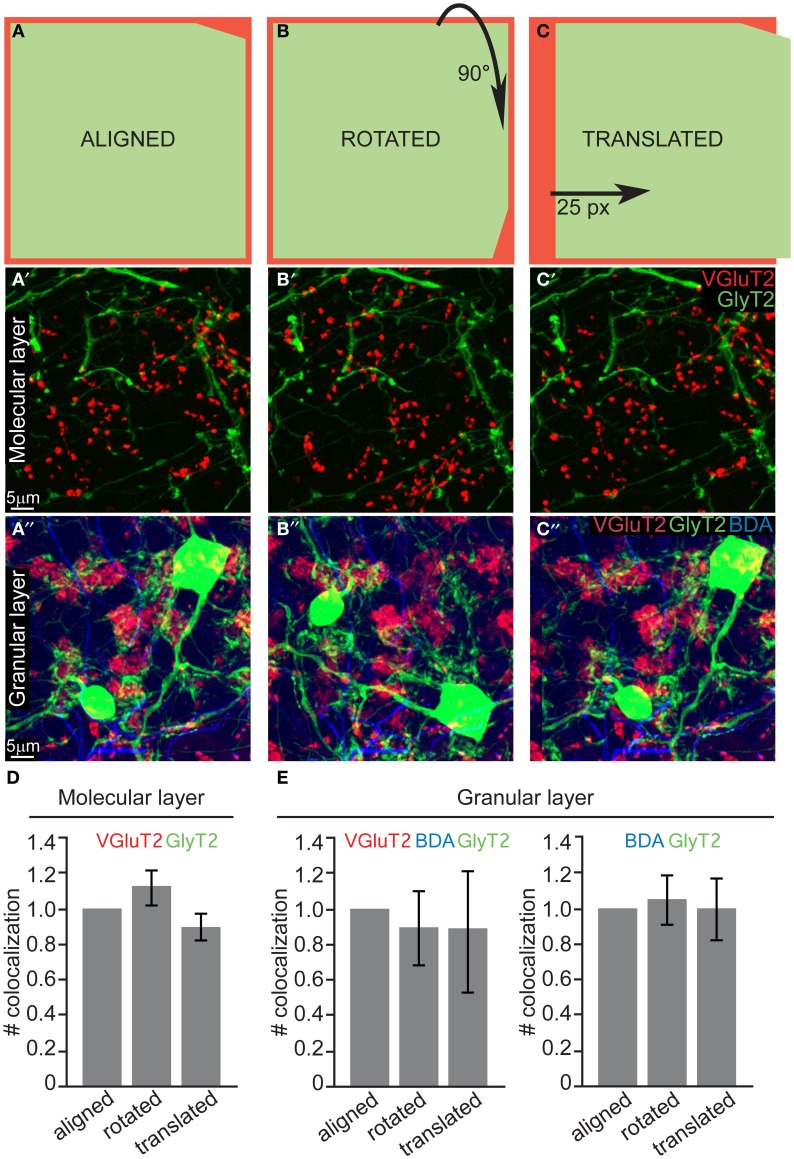
Figure 4.
Quantification of potential colocalization in thick slices also returns a negative result. (A) Schematic drawing of the “aligned” configuration, and examples of maximum intensity projections of 10μ m slices from both the ML and GL (A' and A”, respectively). (B–B”) Same as (A–A”) for the “rotated” configuration, in which one channel was rotated 90° clockwise. (C–C”) Same as (A–A”) for the “translated” configuration in which one channel was shifted 25 pixels to the right. (D) Quantification of the number of colocalization between VGluT2 and mGluR2/GlyT2 found in the ML (n = 30, N = 3). (E) Quantification of the number of colocalization between VGluT2, BDA, and GlyT2 or between BDA and GlyT2 only found in the GL (n = 30, N = 3). The values are presented in (D and E) as mean ± s.e.m. and are normalized to the respective aligned configurations for averaging purposes.

