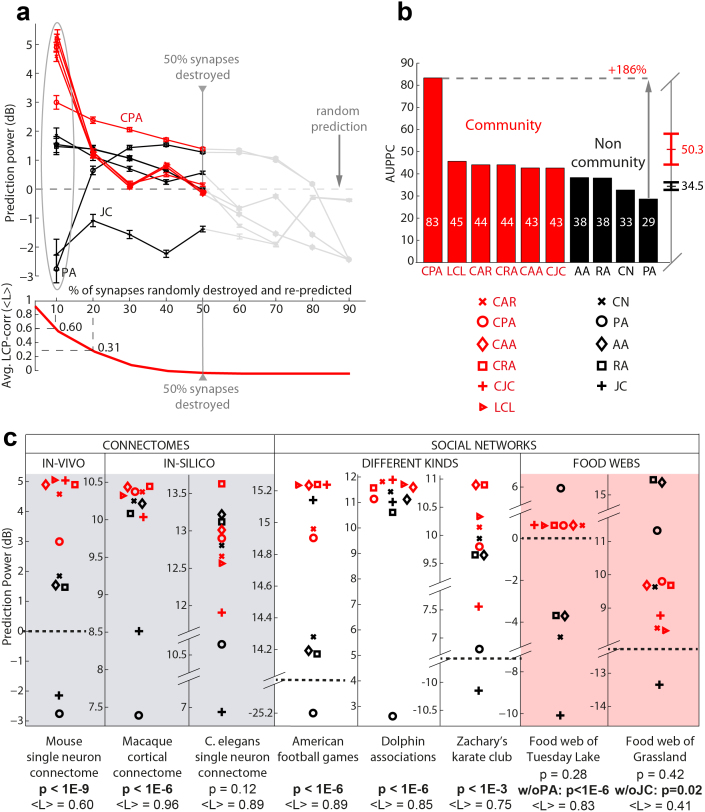
Figure 2. Random deletion followed by topological link re-prediction in brain connectomes, social and ecological networks.
(a) In-vivo single neuron connectome: mouse visual cortex neuro-synaptic connections. Sets of links (synapses) from the mouse connectome were progressively removed uniformly at random. Each prediction technique assigned a score to the missing synapses and this score was used to sort a list of candidate synapses. Upon removal of n links from the network, the same number was taken from the top of the candidate list; by comparing the candidate set with the removed set, we assessed the technique's precision. Since this process was repeated 1000 times for each sparsification level (ranging from 10% to 90% of removed synapses), in practice mean precision and standard error were considered at each stage. To assess deviation from the mean random-predictor performance, the Prediction-Power was computed in decibel (dB):  ; thus, considering the different levels of sparsification, a Prediction-Power-Curve was generated and the area under this curve (AUPPC) was adopted as a comprehensive measure of performance (see Methods section and SI, section IV). Notice that the progressive removal of links from the original topology made the average LCP-corr drop down to the point where it is almost 0. (b) Since deletion of more than 50% synapses caused node isolation and the disappearance of local communities, the AUPPC for the plots in panel (a) was computed considering only half of the experimental range (10% to 50%). CAR-based indices provided an average AUPPC of more than 50, and the performance of the best approach (CPA), represented a 186% improvement over the lowest performing technique (PA). JC was not reported. (c) The performance of CAR-based and classical predictors was also studied over 8 different networks when 10% of the links were removed 1000 times uniformly at random (which ensures community preservation and a fair benchmarking, see average LCP-corr values <L> below each plot). The difference in performance between the CAR-based (in red) and the classical techniques (in black) was statistically significant every time the studied network exhibited a LCP structure (see p-values, below each plot computed as a permutation test with 1000 sampling realizations).

