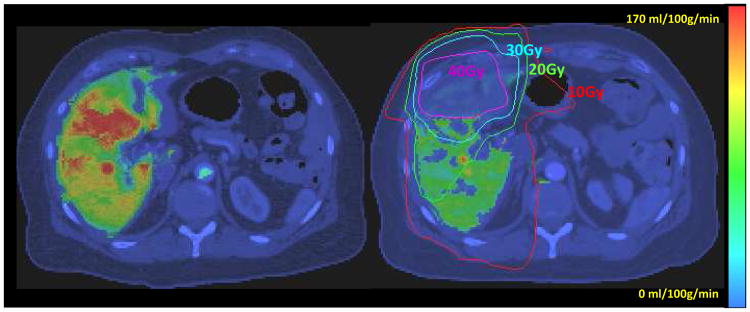
Figure 2.
Portal vein perfusion maps prior to RT (left)_and after the tumor received 46.5 Gy (right) color-coded and overlaid on the liver axial CT. Note that the substantial reduction in venous perfusion in the region received more than 40 Gy (right). Both images were windowed identically. (Figure 3 in Cao et al, Med. Phys. 34(2):604-612, 2007. pending on copy right permission from the journal)

