
Figure 2. Shroom3 and Pitx2 are required for cell shape asymmetries during gut morphogenesis.
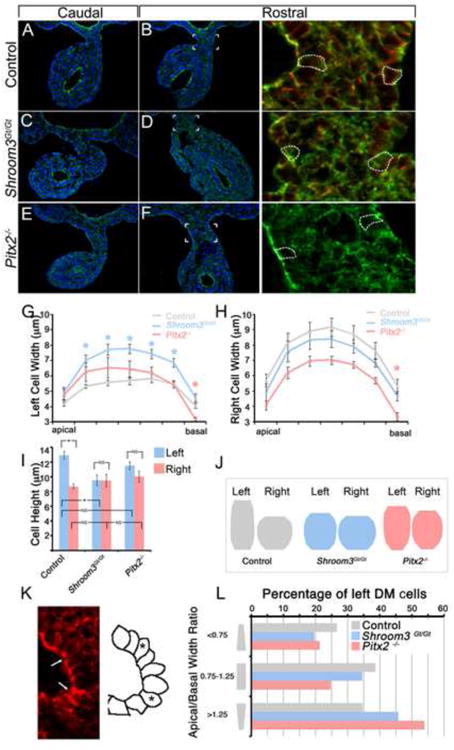
(A-F) E10.75 embryos of the indicated genotype were transversely cyrosectioned caudally, approximately halfway between the fore- and hind-limbs (A,C,E), or rostrally near the duodenum (B,D,F) and immunofluorescently labeled with F-actin (green) and/or β-catenin (red). The area indicated in B, D, and F is magnified and displayed in the right-most panels. The dashed white outlines are traces of β-catenin signal demarcating individual cell borders. (G-I) Traces of the left and right dorsal mesentery epithelial cell outlines were measured and the average widths along the apical-basal axis (G,H) and height (I) were calculated. Asterisks represent statistical significance compared with the control (wt) averages (p<0.05). (J) The average widths and height of left and right dorsal mesentery epithelial cells from the indicated genotypes was quantified and used to generate diagrams representing the average cell shape. (K) Representative image of wild-type left dorsal mesentery epithelium containing apically constricted cells (arrows). The diagram on the right outlines the shape of the cells pictured with asterisks marking apically constricted cells. (L) The number of left DM epithelial cells from embryos of the indicated genotypes, defined by those with an apical/basal width ratio of <0.75, 0.75-1.25, or >1.25 indicating apically constricted, columnar, or basally constricted shapes, respectively, were counted and the total percentage of each type of cell was determined.