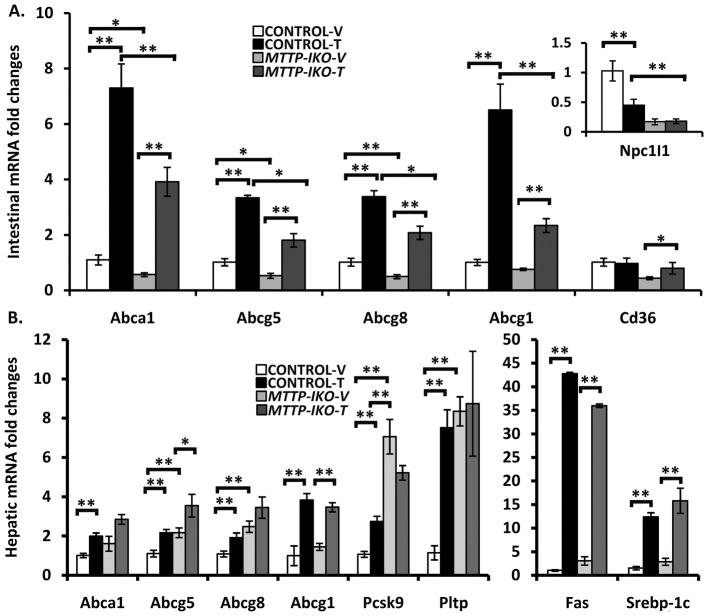
Figure 2. Gene expression changes in intestine and liver of control and MTTP-IKO mice following LXR administration.
(A). mRNA abundance was measured by Q-RT-PCR for the indicated transcripts on intestinal mucosal extracts from 4 mice per group. Inset illustrates the expression levels of NPC1L1. (B). mRNA abundance was measured by Q-RT-PCR for the indicated transcripts on hepatic extracts from 4 mice per group. Symbols * and ** indicate p<0.05 or <0.01, respectively.

