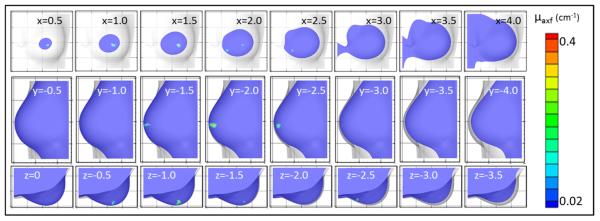
Figure 10.

Contour slices in coronal (top row), sagittal (middle row), and transverse (bottom row) views of the reconstructed μaxf values for the in vivo reconstruction using experimental data for Case #6, where a 0.45 cm3 (0.95 cm diameter) fluorescent target was placed at approximately the 6 o’clock position. The coordinate location of each slice is given in cm.
