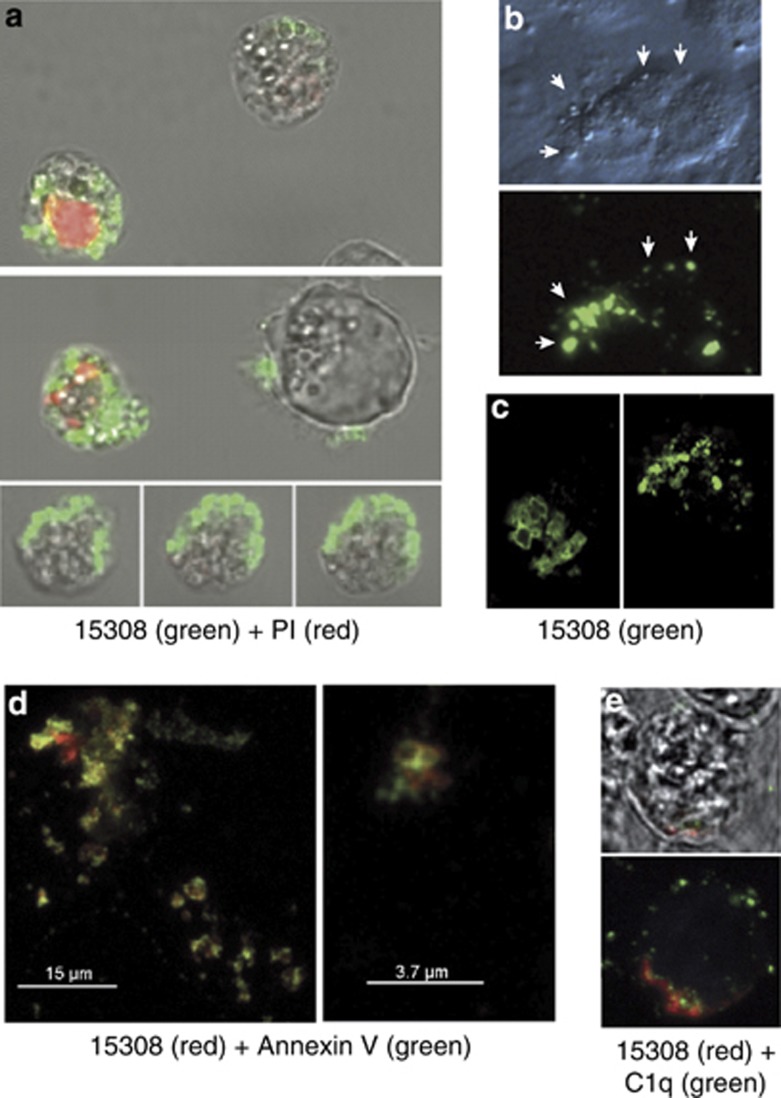
Figure 3.
Appearance of mAb 15308 reactivity on cell surface buds or blebs during apoptosis. (a) Confocal microscopy of exposure of mAb 15308 epitopes at the surface of MUTU I BL cells induced to undergo apoptosis with ionomycin. Binding of mAb 15308 was visualised using secondary antibody labelled with Alexa Fluor-488 (green); plasma membrane integrity was monitored using PI (red). Note that mAb 15308 binds to cells excluding PI as well as to those displaying weak or strong PI staining. (b) Microscopic analysis of mAb 15308 reactivity associated with surface buds (arrowheads) of PI-negative MCF-7 cells triggered to undergo apoptosis with etoposide. Top panel shows surface buds under transmitted light differential interference contrast. (c) Closer inspection by confocal microscopy of surface reactivity of two separate etoposide-treated MCF-7 cells. (d) Confocal fluorescence images of surface 15308 reactivity (visualised using secondary antibody labelled with Alexa Fluor-568, red) colocalised with AxV binding sites (most likely PS) visualised with streptavidin-labelled Alexa Fluor-488, green) on etoposide-treated MCF-7 cells. (e) Confocal microscopic analysis of mAb 15308 reactivity (red) and C1q binding (biotinylated C1q visualised with streptavidin–Alexa Fluor-488, green) at the surface of MUTU I BL cells induced to undergo apoptosis with ionomycin. No staining was observed when biotinylated IgG1 was used instead of C1q or when isotype control replaced mAb 15308 (not shown). Membrane integrity was monitored by exclusion of TO-PRO-3, which fluoresced blue in permeable cells (not shown). The upper panel is a bright field image overlaid with the fluorescence associated with a mid-way Z-section, and the lower panel shows total cell-associated fluorescence

