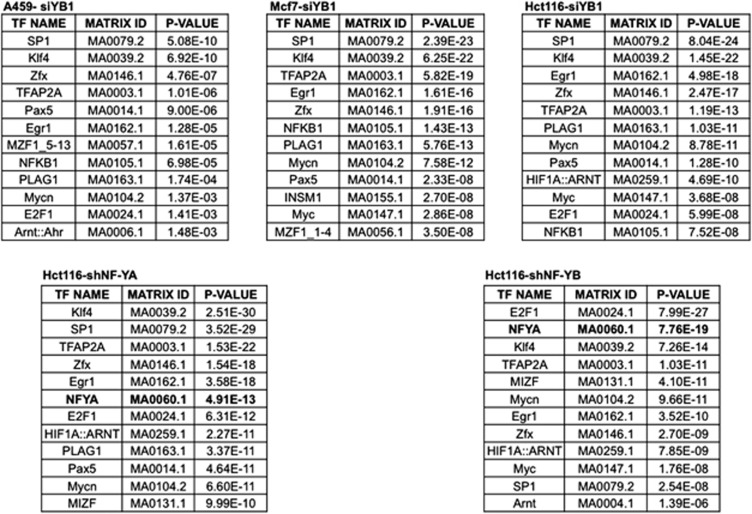
Figure 3.
Enriched TFBS in YB-1- or NF-Y-regulated genes. Data of gene expression profilings of different cell lines, reported by Lasham et al.,123 were analyzed by pscan (upper panels). In the lower panels, a similar analysis is reported on gene expression profiles of HCT116 cells inactivated with shNF-YA or shNF-YB (Benatti et al.124)

