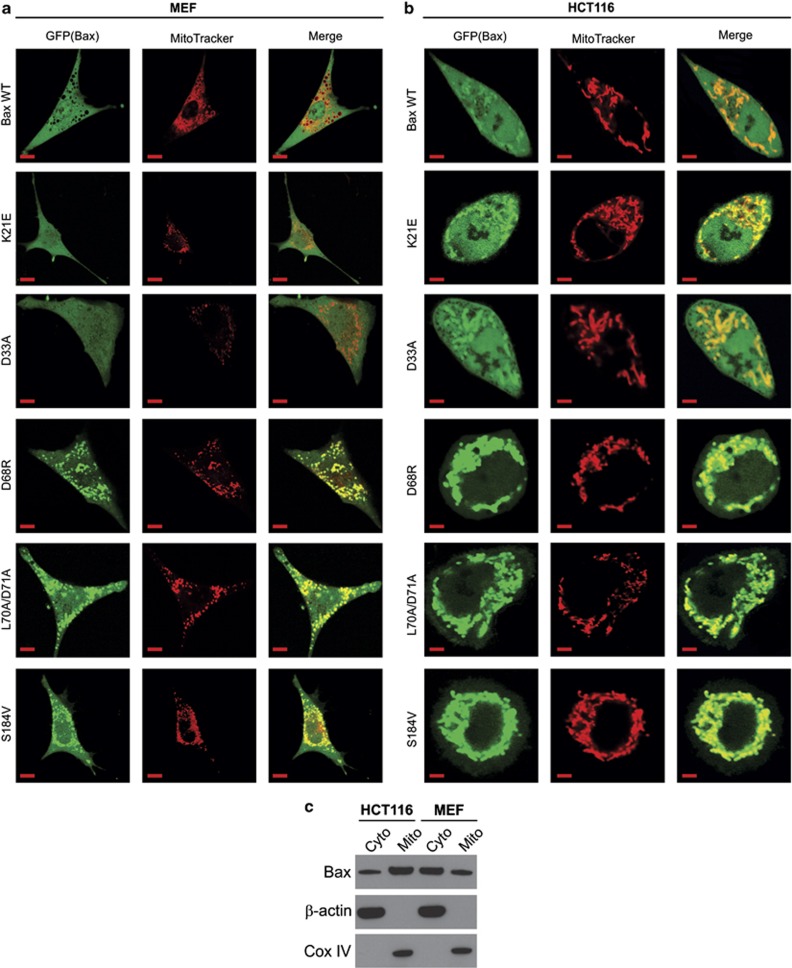
Figure 6.
Comparison of subcellular localization of WT and mutant Bax in HCT116 and MEF cells. (a) WT Bax or indicated mutants were transfected into MEF cells. Localization of transfected Bax was indicated by GFP fluorescence (green). Mitochondria were stained by MitoTracker Red (red). Scale bars: 5 μm. (b) WT Bax or indicated mutants were transfected into BAX-KO HCT116 cells, and then analyzed as in (a) for Bax localization. Scale bars: 5 μm. (c) Cytosolic (Cyto) and mitochondrial (Mito) fractions isolated from healthy HCT116 and MEF cells were normalized and then probed for Bax by western blotting. Cox IV and β-actin were used as control for loading and fractionation

