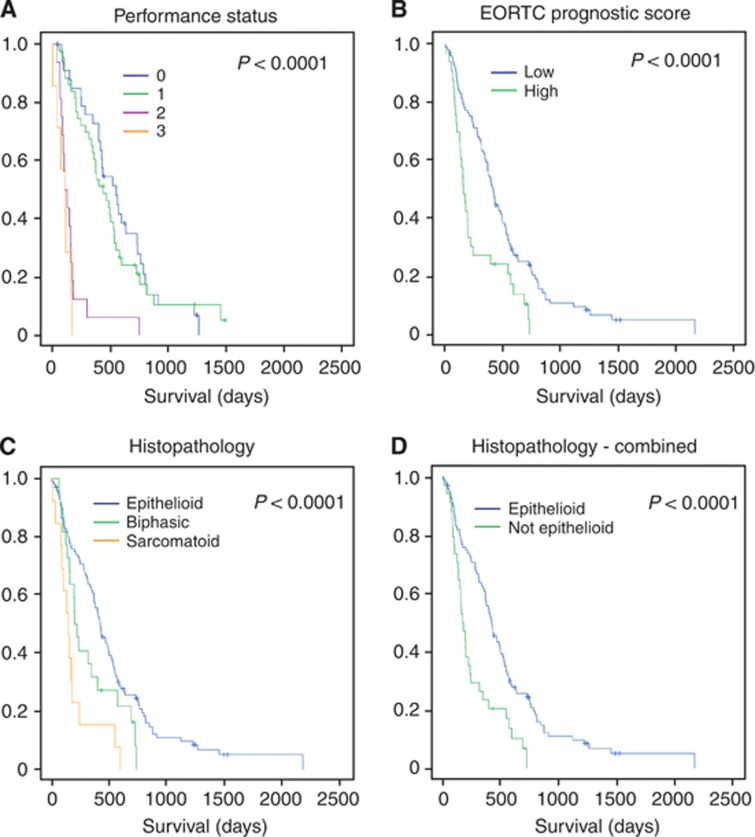
Figure 2.
Mesothelioma patient characteristics and prognosis. Kaplan–Meier curves corresponding to demographic data. (A) ECOG performance status (0, blue; 1, green; 2, purple; and 3, orange). (B) EORTC prognostic score=0.55 (if white cell count >8.3 × 10⁹ cells per l)+0.6 (ECOG performance status is 1 or 2)+0.52 (if histology probable)+0.60 (if histology is sarcomatoid)+0.60 (if gender is male); low <1.27, high ≥1.27 (Fennell et al, 2005). (C) Histological sub-type. (D) Histological sub-type with sarcomatoid and biphasic combined as ‘not epithelioid'. Statistical significance is indicated in figures A–D, top right. Univariate survival analysis used the log-rank test. Points censored from the statistics because the patient remained alive at the time of analysis are indicated as crosses.

