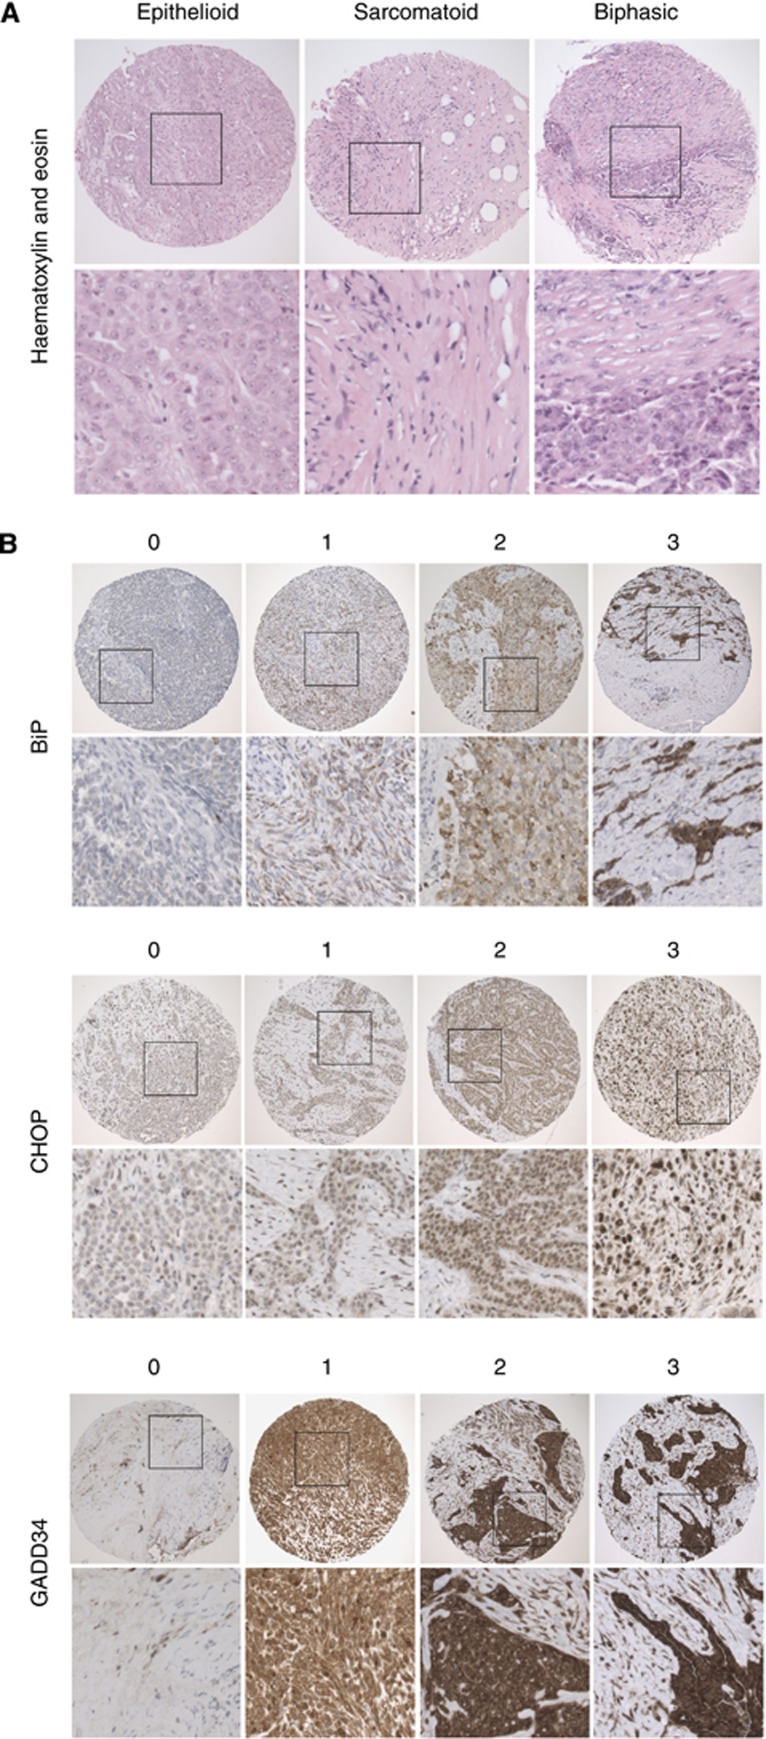
Figure 3.
Tissue microarray stained for markers of ER stress. (A) Tissue microarray of 0.6 mm cores of representative epithelioid, sarcomatoid and biphasic malignant mesothelioma stained with H&E × 40 (insert box × 100). (B) Representative images of tissue microarray cores stained for BiP, CHOP and GADD34, indicating intensities scored from 0 to 3 after the method by Allred et al (1998): 0, negative; 1, detectable but weak; 2, moderate but submaximal; or 3,maximal; × 40 (insert × 100).

