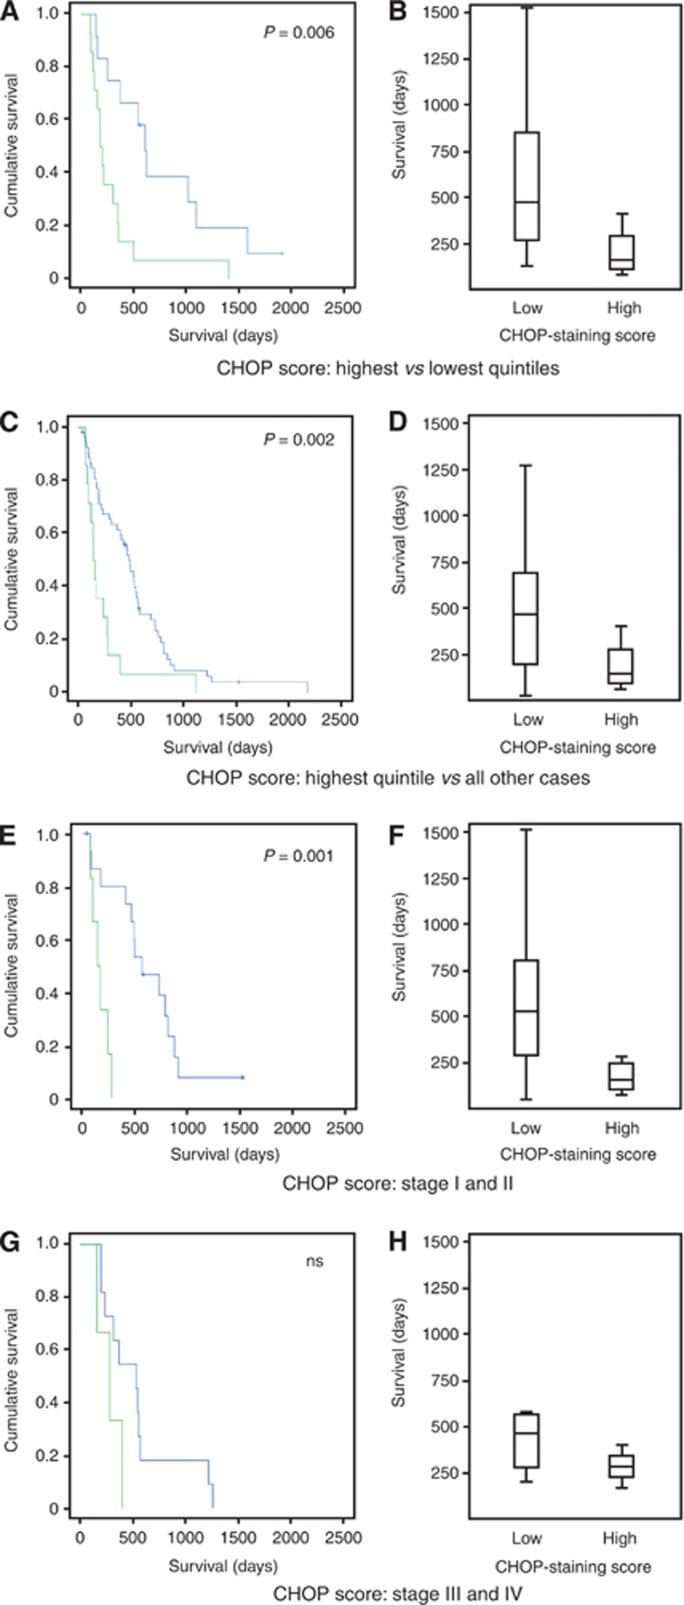
Figure 5.
CHOP score predicts prognosis. Kaplan–Meier curves and box-and-whiskers plots of mesothelioma patient groups defined by CHOP score. (A, B) Upper (green) and lower (blue) quintiles of CHOP score. Median survivals±s.e.: CHOP high 145±0.17 days; CHOP low 486±48 days. (C, D) Upper quintile (green) and remaining cases (blue). Median survival±s.e.: CHOP high 145±0.17 days; CHOP low 486±55 days. Censored cases are represented by crosses. (E–H) Survival of CHOP-defined groups stratified by stage. (E, F) Stages I and II combined: CHOP high 145±45 days; CHOP low 568±145 days. (G, H) Stages III and IV combined: CHOP low 284±100 days; CHOP low 536±127 days.

