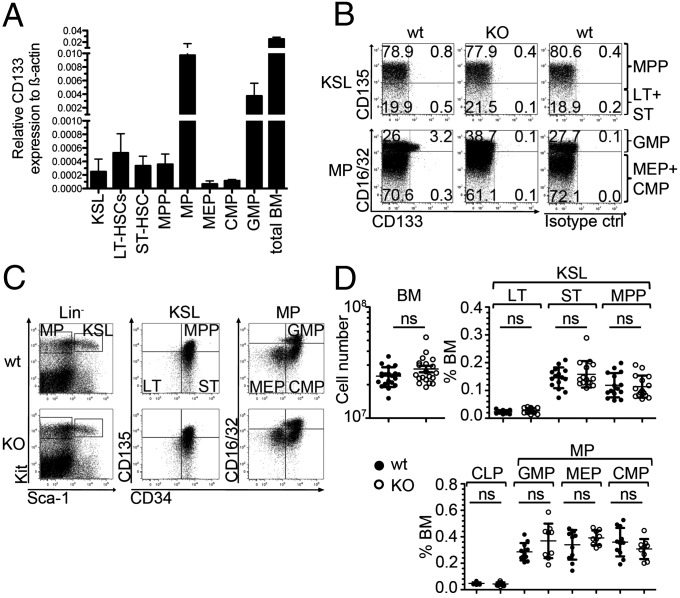
Fig. 1.
Expression of CD133 on mouse HSCs/HPCs and its effects on stem or progenitor cell numbers. (A) Quantitative expression analysis of CD133 by indicated purified cell populations (KSL, LT-HSC, ST-HSC, MPP, MP, MEP, CMP, GMP) or total bone marrow (BM) cells from wild-type mice. Results show mean ± SD of CD133 transcript expression relative to transcripts of β-actin (Actb) (n = 2). (B) Dot plots show the expression of CD133 on KSL (Upper) or MP (Lower) of wild-type (wt) (Left) and CD133 KO (KO) (Center) mice. Staining of the isotype control antibody on wild-type cells is depicted (Right). KSL population is further resolved discriminating between MPPs and ST-HSCs (ST) plus LT-HSCs (LT) (Upper), and the MP population is further resolved discriminating between GMP and MEP plus CMP (Lower). Data are representative for eight wild-type and eight CD133 KO mice analyzed in two independent experiments. In all wild-type mice, CD133 cell surface expression was only detected in a fraction of GMPs (2.7 ± 0.9%, n = 8). (C) Dot plots show the expression of Kit versus Sca-1 on lineage negative cells (Lin−) (Left), CD135 versus CD34 on KSL cells (Center), and CD16/32 versus CD34 on MPs from wild-type (wt) (Upper) and CD133 KO (KO) (Lower) mice. Data are representative for 15 mice per genotype analyzed in three independent experiments for KSL, and 11 wild-type and 9 CD133 KO mice analyzed in two independent experiments for MP analysis. Data are quantified in D. (D) Plots show the numbers of BM cells and frequencies of LT-HSCs (LT), ST-HSCs (ST), and MPPs or common lymphoid progenitors (CLPs) and MPs separated into MEPs, CMPs, and GMPs in wild-type mice (wt) (closed circles) and CD133 KO mice (KO) (open circles) as shown in C. Data are pooled from three independent experiments using 20 mice per genotype for BM cell numbers, 15 mice per genotype for KSL analysis, and 11 wild-type and 9 CD133 KO mice for CLP and MP analysis. Results represent means ± SD. ns, not significant.

