Fig. 4.
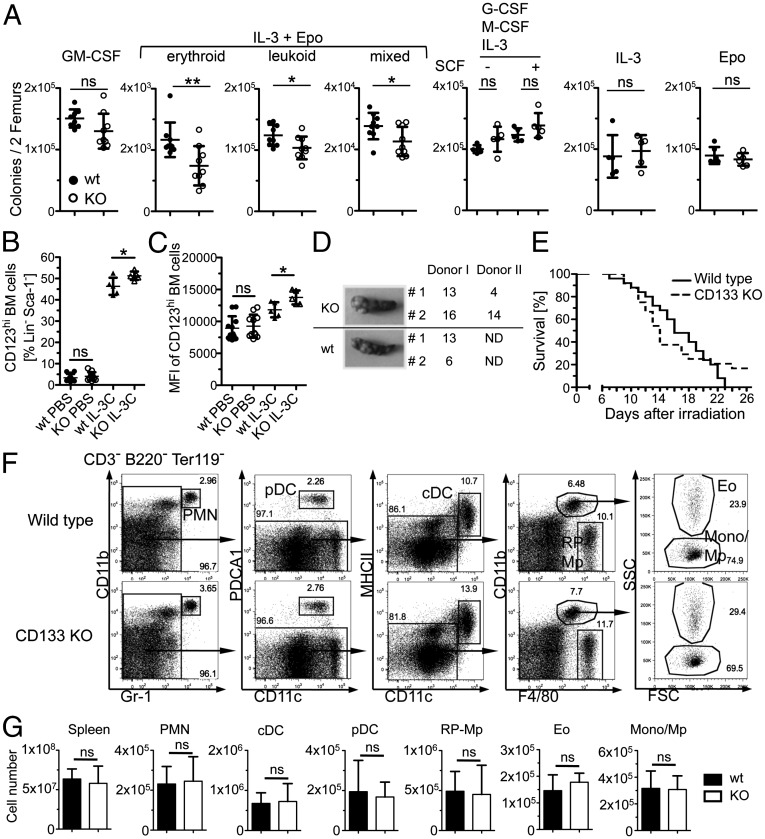
Changes in in vitro colony formation and IL-3 receptor expression but no effect on CFU-S formation, sensitivity to γ irradiation, and the pool size of mature myeloid populations. (A) Plots show in vitro colony formation after culture of wild-type or CD133 KO bone marrow cells with GM-CSF, IL-3 plus erythropoietin (Epo), G-CSF plus M-CSF plus IL-3 with and without SCF, IL-3, or Epo (from left to right). Plots show means ± SD of nine mice per genotype (GM-CSF, IL-3+Epo), six mice per genotype (Epo), and five mice per genotype (G-CSF+M-CSF+IL-3± SCF, IL-3). Significant differences were indicated. *P = 0.05–0.01; **P = 0.01–0.001. (B) Plot shows frequency of CD123hi cells in Lin− Sca-1− bone marrow cells with or without in vivo stimulation with IL-3 complexes (IL-3C). Results show means ± SD of 11 or 5 mice per genotype for PBS control or IL-3 complex injections, respectively. (C) Plot shows the mean fluorescence intensity (MFI) of CD123 expression on CD123hi cells. Data presentation as described in B. (D) Macroscopically visible colonies in the spleen of recipient mice were counted 8 d [(CFU-S day 8 (CFU-Sd8)] after transplantation of CD133 KO or wild-type bone marrow (BM) cells. Photographs show one representative recipient spleen from each donor. (E) Survival curve of wild-type (solid line) and CD133 KO (broken line) mice after lethal irradiation. Data are pooled from three independent experiments using a total of 25 wild-type or CD133 KO mice. (F) Dot plots show the expression of CD11b vs. Gr-1, PDCA1 vs. CD11c, MHCII vs. CD11c, CD11b vs. F4/80, and side scatter (SSC) vs. forward scatter (FCS) (from left to right) on spleen cells from wild-type (Upper) and CD133 KO (Lower) mice on CD3-, B220-, and Ter119-negative cells. Arrows indicate the population that was further resolved in the following dot plot. cDC, conventional dendritic cells; Eo, eosinophils; Mono/Mp, monocytes/macrophages; pDC, plasmacytoid dendritic cells; PMN, neutrophils; RP-Mp, red pulp macrophages. Data are summarized in E. (G) Graphs show the cell number of spleen cells, PMNs, cDCs, pDCs, RP-Mps, eosinophils, and monocytes/macrophages (from left to right) in wild-type (closed bar) and CD133 KO (open bar) mice identified as shown in C. Means ± SD are given (n = 6 mice per genotype).

