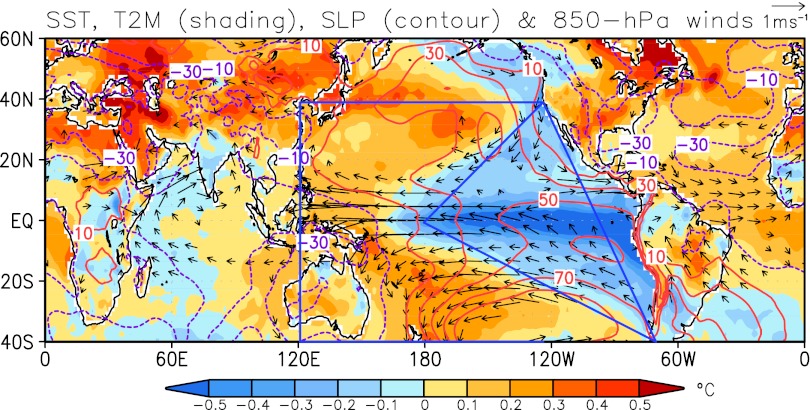
Fig. 3.
Climate anomalies associated with the NHSM circulation index. Regressed 2-m air temperature anomalies over land and SST anomalies over ocean (shading; in degrees Celsius), sea-level pressure anomalies (contours; in pascals) and 850-hPa wind anomalies (vector) with respect to the NHSM circulation (VWS) index for the period of 1979–2010. Wind vectors are significant at 95% confidence level by the Student t test. The blue lines outline the eastern Pacific triangle and western Pacific K-shape regions where the mega-ENSO index is defined. The HadISST and ERAI reanalysis data were used.

