Fig. 3.
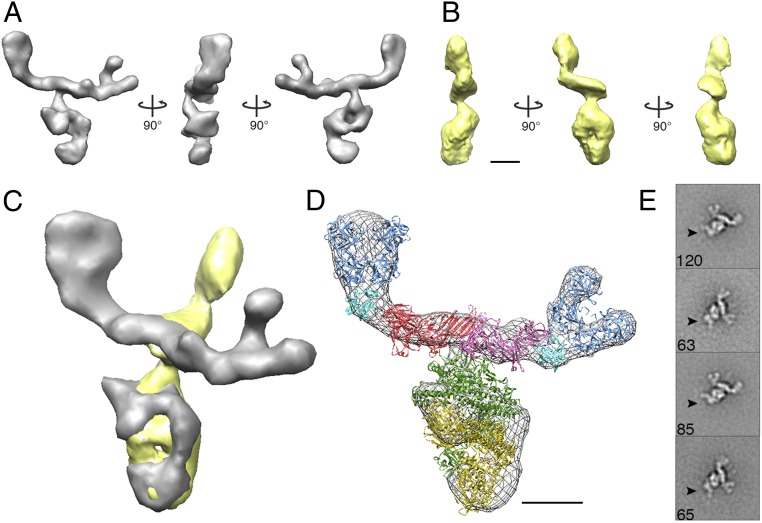
The molecular organization of the BoNT/A1 PC. (A) Surface representations of 3D reconstructions of the BoNT/A1 “flat” view and (B) “prong” view in negative stain. (C) An alignment of the two BoNT/A1 3D views reproduces the three-armed complex observed in our EM micrographs. (D) Crystal structures (from Fig. 1A) placed into a mesh representation of the flat view reconstruction. (E) Class averages of the BoNT/A1 PC with an antibody specific to the neurotoxin’s catalytic domain reveal specific binding at the end of the ovoid body furthest away from the HA proteins (black arrows). (Scale bars in A–D, 50 Å.)

