
Fig. 4.
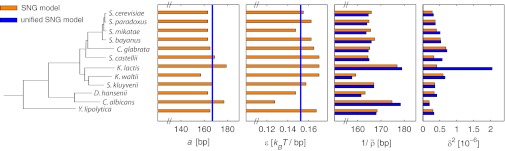
Bar graph of the parameter values for the species shown in the phylogeny as inferred from the independent (orange) and unified (blue) SNG models. The rightmost column shows the mean-square deviation δ2 between experimental and model patterns. For the unified SNG model, the interaction range a and binding energy ε are global parameters (inferred values indicated by vertical blue lines). The average repeat length  is a species-specific parameter in both cases. K. lactis is the only species displaying poor agreement with the unified model and was not included in the optimization of the global parameters.