Abstract
High rates of wave-induced erosion along salt marsh boundaries challenge the idea that marsh survival is dictated by the competition between vertical sediment accretion and relative sea-level rise. Because waves pounding marshes are often locally generated in enclosed basins, the depth and width of surrounding tidal flats have a pivoting control on marsh erosion. Here, we show the existence of a threshold width for tidal flats bordering salt marshes. Once this threshold is exceeded, irreversible marsh erosion takes place even in the absence of sea-level rise. This catastrophic collapse occurs because of the positive feedbacks among tidal flat widening by wave-induced marsh erosion, tidal flat deepening driven by wave bed shear stress, and local wind wave generation. The threshold width is determined by analyzing the 50-y evolution of 54 marsh basins along the US Atlantic Coast. The presence of a critical basin width is predicted by a dynamic model that accounts for both horizontal marsh migration and vertical adjustment of marshes and tidal flats. Variability in sediment supply, rather than in relative sea-level rise or wind regime, explains the different critical width, and hence erosion vulnerability, found at different sites. We conclude that sediment starvation of coastlines produced by river dredging and damming is a major anthropogenic driver of marsh loss at the study sites and generates effects at least comparable to the accelerating sea-level rise due to global warming.
Keywords: salt marsh boundary erosion, wave erosion
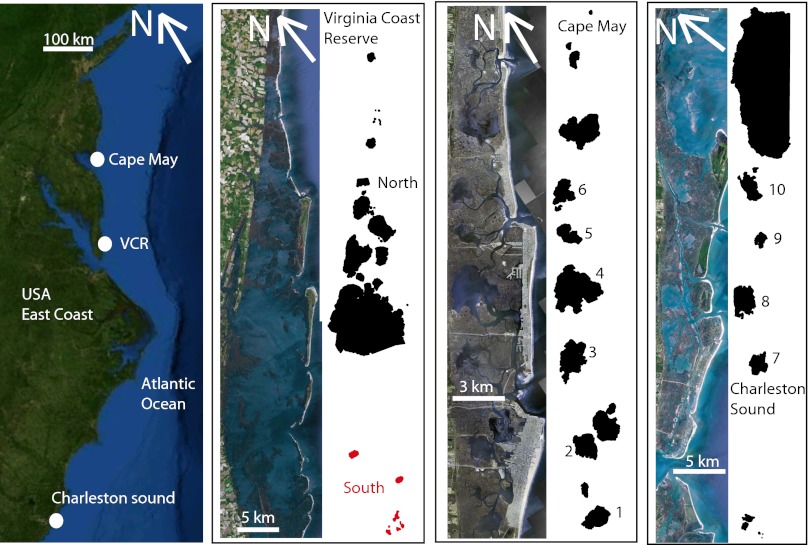
Wave-induced boundary erosion is a leading process threatening salt marshes (1, 2), but it is remarkably unexplored compared with the vertical dynamics of the marsh platform (3, 4). Wave-induced boundary erosion is particularly relevant along coastlines with limited subsidence such as the Mid-Atlantic coast of the United States, where large marsh areas are deteriorating (5, 6) despite marsh accretion keeping pace with contemporary rates of sea-level rise (7, 8). Here, we focus on the evolution of three salt marsh sites on the US Atlantic Coast, subjected to different rates of wave-induced boundary erosion: Cape May, NJ, Virginia Coast Reserve, VA, and Charleston Sound, SC (Fig. 1). All sites are characterized by barrier islands sheltering shallow bays with extensive salt marshes and tidal flats. The bays are connected to the open sea by multiple inlets, experience limited direct riverine inputs (9, 10), and are subject to similar wind conditions (SI Text). Relative sea-level rise (RSLR) is on the order of 2 mm/y and tidal range of ∼1.4 m (SI Text). These embayments are characterized by rounded tidal flats surrounded by salt marshes, which are referred to as marsh basins (11, 12).
Fig. 1.
Location of the three study sites: Cape May, NJ, Virginia Coast Reserve, VA, Charleston Sound, SC (29). The marsh basins are drawn as polygons with a GIS software.
Stevenson et al. (13) reported loss of brackish marshes driven by the enlargement of marsh basins, referred to by the authors as ponds. They suggested the existence of a pond threshold width that, once exceeded, leads to ponds widening by wave-induced boundary erosion. Here, we expand this idea by (i) developing a physically based model for the morphological evolution of marsh basins and (ii) collecting and analyzing an extensive dataset of marsh basin morphology.
Because locally generated wind waves are controlled by fetch and water depth, both variables should be accounted for when predicting the morphological evolution of a marsh basin. We therefore develop a simple dynamic model that includes the following processes: (i) wave power and related marsh boundary erosion increases with tidal flat fetch and depth; (ii) marsh boundary erosion increases the fetch of the adjacent tidal flats, thus increasing wave power (1, 14); (iii) marsh boundary erosion releases sediments that become available to settle on the tidal flats, reducing water depths and thus decreasing wave power (1, 14, 15); (iv) fetch and depth control sediment resuspension by waves on the tidal flat. This resuspension mechanism, combined with tidal fluxes, determines the sediment exchange with the open sea and whether the tidal flat erodes or aggrades in time (16).
Dynamic Model
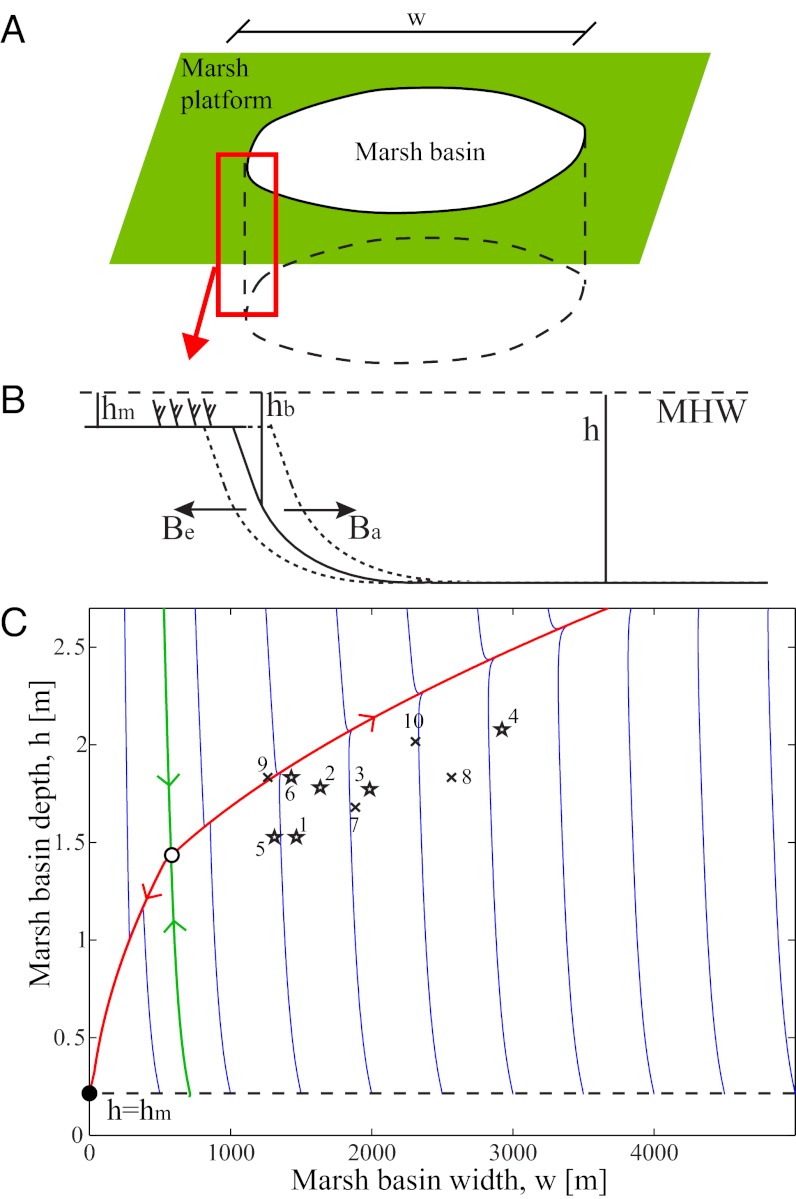
We approximate a marsh basin with a cylinder carved into a salt marsh (Fig. 2A). The basin has a characteristic width w and a characteristic depth h computed with respect to mean high-water level (MHW), a datum that varies with RSLR. The marsh platform has a depth of hm with respect to MHW (Fig. 2B). Assuming that the marsh platform accretes vertically with the same rate of RSLR (3), hm is a constant that we set here equal to 0.2 m, a typical value for Mid-Atlantic marshes (3). Marsh boundaries are characterized by a steep cliff connected to the tidal flat through a gently sloping profile. The depth of the cliff base hb is assumed to increase with the tidal flat depth, and it is computed by means of a semiempirical bed profile (SI Text).
Fig. 2.
(A) Scheme of a marsh basin. (B) Scheme of the marsh boundary. (C) w-h phase space of the marsh basin dynamic model, with r = 1.4 m, Co = 30 mg/L, ka = 2, ke = 0.1 m3·y−1·W−1, RSLR = 2 mm/y, Uwind = 8 m/s. A single unstable non-trivial equilibrium (white circle) is present. The unstable manifold (red curve) quickly attracts all trajectories. Initial conditions to the left of the stable manifold (green curve) belong to the basin of attraction of the point [0, hm], while initial conditions to the right of the stable manifold belong to the basin of attraction of the point [∞,h∞], where h∞ is the fetch-unlimited depth equilibrium. The stars and crosses represent the depths and diameters of 10 marsh basins along the US Atlantic Coast (Fig. 1 and Table S1).
Changes in basin width (Fig. 2) stem from the competition between marsh boundary erosion Be [m/y] and marsh boundary progradation Ba [m/y]:
 |
The marsh erosion rate is set equal to the incoming wave power density at the marsh boundary, W (SI Text), multiplied by an erodability coefficient ke and divided by the marsh boundary cliff face height hb
− hm (1). Marsh boundary progradation is simulated as a redistribution of tidal flat sediments toward peripheral areas, which tend to be sheltered from the action of waves and currents. We model marsh boundary progradation as a gently sloping surface dominated by accretion, obtaining  , where ka is a nondimensional parameter related to the marsh boundary geometry and here fixed equal to 2 (SI Text), ws is the settling velocity set equal to 0.5 mm/s, ρ is the dry sediment bulk density, set equal to 1,000 kg/m3, and Cr is the reference sediment concentration in the basin, assumed to be controlled by the wave-induced bed shear stress τw (SI Text).
The basin depth is controlled by three terms:
 |
where the first term on the right-hand side is the mass-conserving redistribution of the sediments eroded or accumulated at the marsh boundary, Fc is the net sediment flux exchanged between the marsh basin and the open sea, Fm is the net sediment flux exchanged with the salt marsh platform, Af is the marsh basin area, and R is RSLR.
Fm is computed as the amount of sediments imported by a salt marsh of area Am to keep pace with RSLR, i.e., Fm = ρAmR. Here, we assume that the salt marsh area over which sediment coming from the flats is deposited is approximately equal to the tidal flat area, i.e., Am = Af.
Fc is computed through the tidal dispersion mechanism (17) as  , where Co is the sediment concentration in the open sea, Tω is the tidal period, set equal to 12.5 h, and P is the tidal prism. We calculate the tidal prism as
  , where r is the tidal range.
To close the model, we compute the local wave regime responsible for both sediment resuspension in the tidal flats and erosion of the marsh boundary as a function of wind speed and basin width and depth, using semiempirical relationships (18) (SI Text).
Results
Numerical investigations show that the model admits a single nontrivial unstable equilibrium point (Fig. 2C). The stable manifold of this point divides the phase space into two regions: one is the basin of attraction of the point corresponding to a marsh without tidal flats, whereas the other is the basin of attraction of the point corresponding to an infinitely large tidal flat with a finite depth (Fig. S1). This depth is such that the tidal flat bed is in equilibrium with the fetch-unlimited wave regime. Because the stable manifold is characterized by a nearly constant basin width (i.e., a vertical line in the w–h plane), the width associated with the unstable equilibrium point is the discriminant horizontal scale for basin evolution. Basins smaller than the critical size contract and eventually disappear, whereas basins wider than the critical size expand indefinitely. The migration rate Be – Ba increases with the basin size and tends toward an asymptotic rate controlled by the fetch-unlimited wave condition (Fig. S1). In reality, basin expansion stops when the entire salt marsh is eroded, and the basin width is determined by the geological constrains of the bay, i.e., the distance between the barrier islands and the mainland. In this fetch-limited condition the tidal flat finds an equilibrium depth, recovering the stable configuration predicted by single point models (19–21) (SI Text and Fig. S2).
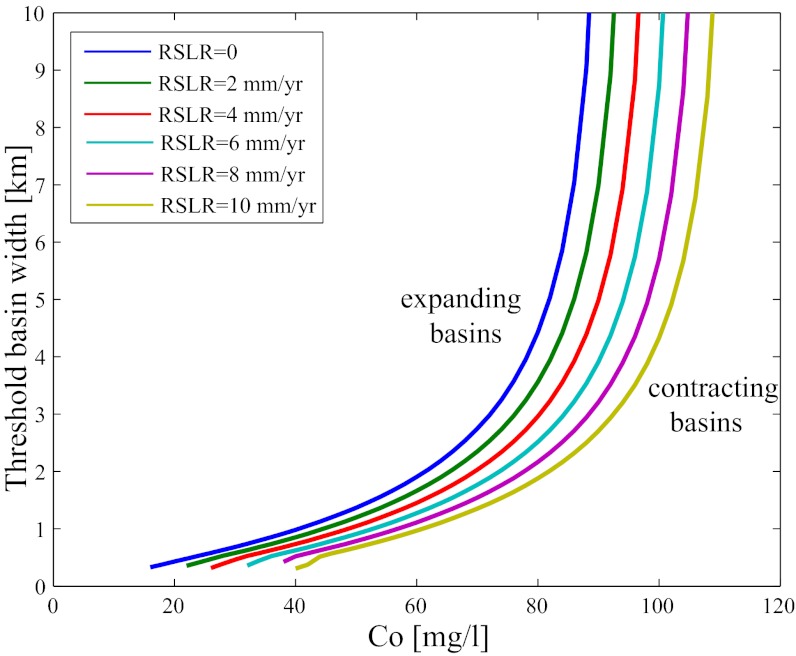
For elevated sediment concentrations the asymptotic migration rate is negative, i.e., the progradation rate Ba is greater than the erosion rate Be. The unstable equilibrium disappears, and the configuration with only salt marshes becomes a global attractor, with the basins contracting independently of their initial size (Fig. 3 and Fig. S1). In summary, the model predicts that when marsh boundary migration is allowed, a stable equilibrium with coexisting tidal flat and salt marsh is not present.
Fig. 3.
Threshold basin width as a function of the external sediment concentration Co and RSLR, showing a high sensitivity with respect to the former parameter. r = 1.4 m, ke = 0.1 m3·y−1·W−1, ka = 2, Uwind = 8 m/s.
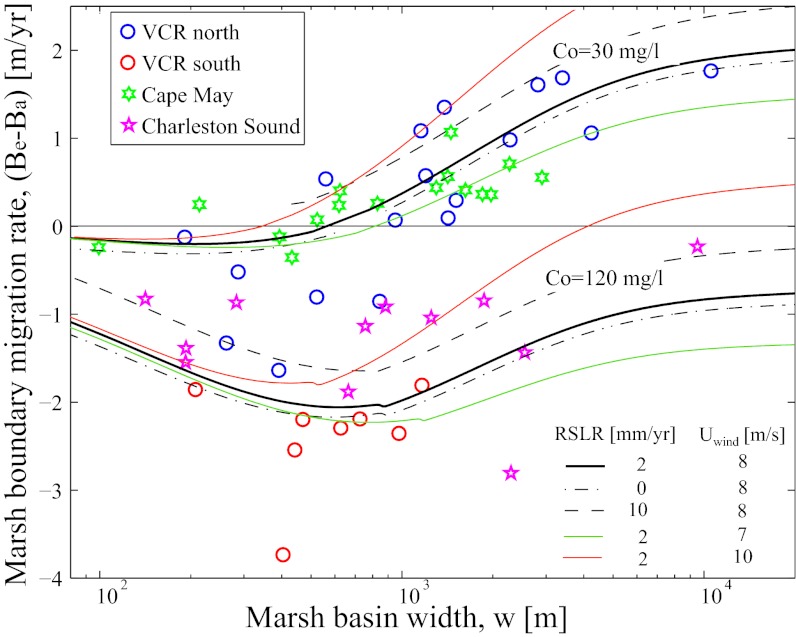
Insights about marsh dynamics are obtained by computing the marsh boundary migration rate as a function of basin width from aerial photographs taken 50 y apart (SI Text). Both the northern portion of the Virginia Coast Reserve and Cape May sites show that the marsh boundary progrades for basin widths smaller than ∼1 km and retreats for larger basins (Fig. 4). For both sites the expansion rate increases with basin width, tending to an asymptotic value. The southern portions of the Virginia Coast Reserve and Charleston Sound display only contracting basins, suggesting that all of the basins are smaller than the threshold width (Fig. 4).
Fig. 4.
Marsh boundary migration rate (positive if retreating) as a function of marsh basin width. Points are data from the three sites (Fig. 1 and Table S2). Lines are model results, for different values of Co, RSLR and Uwind, r = 1.4 m, ke = 0.1 m3·y−1·W−1, ka = 2.
Measured migration rates are compared with those predicted by the model, following the trajectory on the unstable manifold. This simplification is supported by the observation that all trajectories are quickly captured by the unstable manifold, and therefore the majority of the marsh basin evolution occurs along this curve. Available data on basin width and depth confirm this result (Fig. 2C). This behavior reflects the fact that the basin depth adjusts faster than basin width, and hence the basin evolution is a succession of quasi-steady equilibria.
The two parameters ke and Co are determined for each site by minimizing the root-mean-square error between the observed and predicted migration rates (SI Text and Table S3). The values that best reproduce the boundary migration rate are ke = 0.14 m3·y−1·W−1 and Co = 60 mg/L for the northern Virginia Coast Reserve site and ke = 0.06 m3·y−1·W−1 and Co = 20 mg/L for the Cape May site (Fig. S3). Assuming an average value of ke = 0.1 m3·y−1·W−1 for both sites, the best-fitting concentration is 30 mg/L (Fig. S3). With this parameter choice the model predicts a critical width of about 1 km and an asymptotic erosion rate of ∼2 m/y (Fig. 4 and Fig. S1). The southern Virginia Coast Reserve migration rates are best predicted by Co = 130 mg/l, assuming ke = 0.1 m3·y−1·W−1 as for the northern part. Charleston Sound rates are best predicted by ke = 0.06 m3·y−1·W−1 and Co = 80 mg/L (Fig. S3). If ke is assumed equal to 0.1 m3·y−1·W−1, the optimal concentration reads 110 mg/L (Fig. S3). With a sediment concentration of 120 mg/L the model predicts that all of the basins will contract (Figs. 3 and 4).
Different values of ka affect the optimal value of Co, but they always predict lower sediment concentration in the northern Virginia Coast Reserve and Cape May than in the southern Virginia Coast Reserve and Charleston Sound sites (Fig. S4). In addition, a sensitivity analysis reveals that large variations of RSLR (0–10 mm/y) and wind speed (7–10 m/s) are not able to explain the difference between the sites (Fig. 4). These analyses suggest that variations in sediment availability are likely the cause of the different marsh basin dynamics.
Discussion and Conclusions
Predictions from our simplified model of marsh basin dynamics are in agreement with historical trends of sediment supply to the coast. The 20th century was characterized by a decrease of sediment export from the Delaware Estuary and Chesapeake Bay (14, 22), which constitute the main sediment sources for the New Jersey and Virginia marshes. Sediment inventories suggest that sediment removed from the Delaware Estuary by periodic dredging is not replenished by the input from upstream tributaries (22), drastically reducing the sediment supply to the near-shore continental shelf. The lack of offshore sediment inputs is one of the causes of sediment starvation within the Virginia marshes (12, 23). An exception is notable in the southern portion of the Virginia Coast Reserve, where close proximity to a sediment depositional cell formed by tidal fluxes out of Chesapeake Bay promotes higher sediment availability (24).
On the other hand, North Inlet marshes (SC), located about 50 km north of Charleston Sound, have imported a substantial quantity of inorganic sediments from the ocean, which allowed them to keep pace with RSLR (10). This high sediment availability has been associated with the discharge of the adjacent Pee Dee River (25). Similarly, the elevated availability of inorganic sediment in the Charleston marshes is probably associated with the vicinity of the Cooper and Santee Rivers.
We showed that irreversible marsh collapse can occur because of the positive feedback between marsh boundary erosion, tidal flat bed erosion, and wave generation in tidal flats. Sediment starvation deepens tidal flats and inhibits marsh boundary progradation. Marsh erosion widens nearby tidal flats, thus increasing wave energy and promoting further erosion in a runaway effect. RSLR enhances this process by deepening tidal flats and increasing the sediment flux from tidal flats to salt marshes. The dynamics of the marsh boundary is primarily controlled by sediment supply rather than RSLR, as shown by a sensitivity analysis (Figs. 3 and 4). In addition, irreversible marsh erosion via horizontal retreat can occur in the absence of RLSR, a scenario not predicted by models of salt marsh vertical evolution (3, 20, 21, 26).
We conclude that lack of sediment supply, often associated with human activities (27), is a major driver of marsh loss at the study sites and generates effects at least comparable to the accelerating sea-level rise due to global warming. This finding advocates for salt marsh preservation projects based on the restoration of the natural sediment supply at the coastline by dam removal and controlled river diversions (28).
Finally, we suggest that the critical basin width could be used as an indicator of a possible shift from a stable, closing marsh basin, to an unstable expanding basin. From the perspective of marsh-loss mitigation, the model can be used to individuate systems near the threshold size, where protection intervention should be concentrated. For example, structures aimed to reduce wave energy might be used to prevent marsh basins from entering the erosive state.
Supplementary Material
Acknowledgments
This research was supported by National Science Foundation Award OCE-0924287 and DEB-0621014 (Virginia Coast Reserve–Long Term Ecological Research program).
Footnotes
The authors declare no conflict of interest.
This article is a PNAS Direct Submission.
This article contains supporting information online at www.pnas.org/lookup/suppl/doi:10.1073/pnas.1219600110/-/DCSupplemental.
References
- 1.Marani M, D’Alpaos A, Lanzoni S, Santalucia M. Understanding and predicting wave erosion of marsh edges. Geophys Res Lett. 2011;38:L21401. [Google Scholar]
- 2.Mariotti G, Fagherazzi S. A numerical model for the coupled long-term evolution of salt marshes and tidal flats. J Geophys Res. 2010;115:F01004. [Google Scholar]
- 3.Morris JT, Sundareshwar PV, Nietch CT, Kjerfve B, Cahoon DR. Responses of coastal wetlands to rising sea level. Ecology. 2002;83:2869–2877. [Google Scholar]
- 4.Kirwan ML, Mudd SM. Response of salt-marsh carbon accumulation to climate change. Nature. 2012;489(7417):550–553. doi: 10.1038/nature11440. [DOI] [PubMed] [Google Scholar]
- 5.Schwimmer RA. Rates and processes of marsh shoreline erosion in Rehoboth Bay, Delaware, U.S.A. J Coast Res. 2001;17(3):672–683. [Google Scholar]
- 6.Greensmith JT, Tucker EV. Salt marsh erosion in Essex. Nature. 1965;206:606–607. [Google Scholar]
- 7.Cahoon DR, et al. Coastal wetland vulnerability to relative sea-level rise: Wetland elevation trends and process controls. In: Verhoeven JTA, et al., editors. Wetlands and Natural Resource Management, Ecol Stud, 190. New York: Springer; 2006. pp. 271–292. [Google Scholar]
- 8.French J. Tidal marsh sedimentation and resilience to environmental change: Exploratory modeling of tidal, sea-level, and sediment supply forcing in predominantly allochthonous systems. Mar Geol. 2006;235:119–136. [Google Scholar]
- 9.Oertel GF, Wong GTF, Conway JD. Sediment accumulation at a fringe marsh during transgression, Oyster, Virginia. Estuaries. 1989;12(1):18–26. [Google Scholar]
- 10.Vogel RL, Kjerfve B, Gardner LR. Inorganic sediment budget for the North Inlet Salt Marsh, South Carolina, USA. Mangroves Salt Marshes. 1996;1:23–35. [Google Scholar]
- 11.Lucke JB. Tidal inlets: A theory of evolution of lagoon deposits on shorelines of emergence. J Geol. 1934;42:561–584. [Google Scholar]
- 12.Boon JD, Byrne RJ. On basin hypsometry and the morphodynamic response of coastal inlet systems. Mar Geol. 1981;40:27–48. [Google Scholar]
- 13.Stevenson C, Kearney MS, Pendleton EC. Sedimentation and erosion in a Chesapeake Bay brackish marsh system. Mar Geol. 1985;67:213–235. [Google Scholar]
- 14.Kearneyo MS, Grace RE. Marsh loss in Nanticoke estuary, Chesapeake Bay. Geogr Rev. 1988;78:2. [Google Scholar]
- 15.Mariotti G, et al. Influence of storm surges and sea level on shallow tidal basin erosive processes. J Geophys Res. 2010;115:C11012. [Google Scholar]
- 16.Chauhan PPS. Autocyclic erosion in tidal marshes. Geomorphology. 2009;110:3–4, 45–57. [Google Scholar]
- 17.Dronkers J. 1988. Coastal-offshore ecosystem. Lecture Notes on Coastal and Estuarine Studies, ed Jansson B-O (AGU, Washington, DC), Vol 22, pp 3–39.
- 18.Young IR, Verhagen LA. The growth of fetch limited waves in water of finite depth. 1. Total energy and peak frequency. Coast Eng. 1996;29:47–78. [Google Scholar]
- 19.Fagherazzi S, Carniello L, D’Alpaos L, Defina A. Critical bifurcation of shallow microtidal landforms in tidal flats and salt marshes. Proc Natl Acad Sci USA. 2006;103(22):8337–8341. doi: 10.1073/pnas.0508379103. [DOI] [PMC free article] [PubMed] [Google Scholar]
- 20.Marani M, D’Alpaos A, Lanzoni S, Carniello L, Rinaldo A. Biologically‐controlled multiple equilibria of tidal landforms and the fate of the Venice lagoon. Geophys Res Lett. 2007;34:L11402. [Google Scholar]
- 21.Marani M, D'Alpaos A, Lanzoni S, Carniello L, Rinaldo A. The importance of being coupled: Stable states and catastrophic shifts in tidal biomorphodynamics. J Geophys Res. 2010;115:F04004. [Google Scholar]
- 22.Stammermann R, Piasecki M. Influence of sediment availability, vegetation, and sea level rise on the development of tidal marshes in the Delaware Bay: A review. J Coast Res. 2012;28(6):1536–1549. [Google Scholar]
- 23.Nichols MM, Boon JD. Sediment transport processes in coastal lagoons. In: Kjerfve B, editor. Coastal Lagoon Processes. New York: Elsevier; 1994. pp. 157–217. [Google Scholar]
- 24.Oertel GF, Overman K. Sequence morphodynamics at an emergent barrier island, middle Atlantic coast of North America. Geomorphology. 2004;58:67–83. [Google Scholar]
- 25.Patchineelam SM, Kjerfve B, Gardner LR. A preliminary sediment budget for the Winyah Bay estuary, South Carolina, USA. Mar Geol. 1999;162:133–144. [Google Scholar]
- 26.Kirwan ML, Murray ABA. A coupled geomorphic and ecological model of tidal marsh evolution. Proc Natl Acad Sci USA. 2007;104(15):6118–6122. doi: 10.1073/pnas.0700958104. [DOI] [PMC free article] [PubMed] [Google Scholar]
- 27.Syvitski JPM, Vörösmarty CJ, Kettner AJ, Green P. Impact of humans on the flux of terrestrial sediment to the global coastal ocean. Science. 2005;308(5720):376–380. doi: 10.1126/science.1109454. [DOI] [PubMed] [Google Scholar]
- 28.Nittrouer JA, et al. Mitigating land loss in coastal Louisiana by controlled diversion of Mississippi River sand. Nat Geosci. 2012;5:534–537. [Google Scholar]
- 29. GoogleEarth. Data from National Aeronautics and Space Administration, US Geological Survey, US Department of Agriculture Farm Service Agency, 2006. Data accessed on May 2012. http://www.google.com/earth/index.html.
Associated Data
This section collects any data citations, data availability statements, or supplementary materials included in this article.


