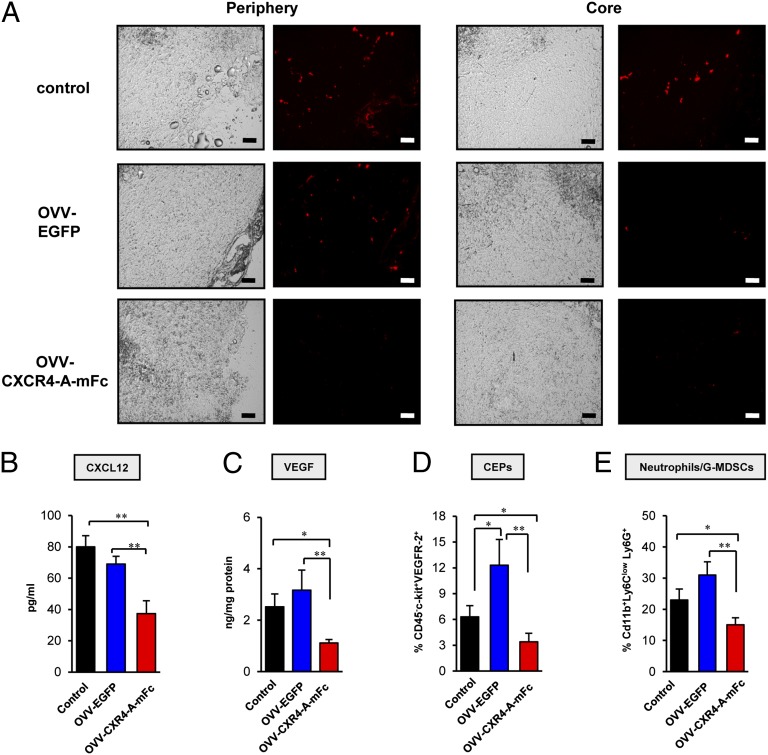
Fig. 3.
Tumor perfusion and changes in expression of CXCL12, VEGF, as well as numbers of CEPs and neutrophils/G-MDSCs induced in tumor after oncolytic virotherapy treatment. (A) Tumor-bearing mice were injected intravenously with 100 μL of a 50% solution of 100-nm-diameter orange fluorescent microspheres. Five minutes later, animals were killed and tumors were immediately snap-frozen for analyses of tumor perfusion by visualizing fluorescent microspheres in the vasculature of fixed sections using a Zeiss Axiophot HRM Inverted fluorescent microscope and analyzed using Image-Pro-6.2 software. (Scale bars, 100 μm.) (B) Intratumoral expression of CXCL12 was determined in tumor stromal cell-enriched supernatants derived from tumors resected on day 8 after the treatment, whereas expression of VEGF (C) was determined in tumor lysates as described in Materials and Methods. ELISAs were performed on media or lysates and colorimetric values were measured by microplate reader at 450 nm. (D) Recruitment of CEPs (CD45-c-kit+VEGFR-2+) was determined in control and virally treated tumors with 8 d after treatment. Single-cell suspensions were prepared from 4T1 tumors and stained with anti–CD45-APC-Cy7, anti–VEGFR-2-PerCP-Cy5.5, and anti–c-kit-PE mAbs. (E) The percentage of mobilization neutrophils/G-MDSCs in control and treatment groups. Cells were stained with anti-CD11b-APC, anti-Ly6C-FITC, and anti–Ly6G-PE mAbs and analyzed by flow cytometry. Background staining was assessed using isotype control antibodies. Results are presented as the means ± SD of three or four independent experiments. *P < 0.05, **P < 0.01.

