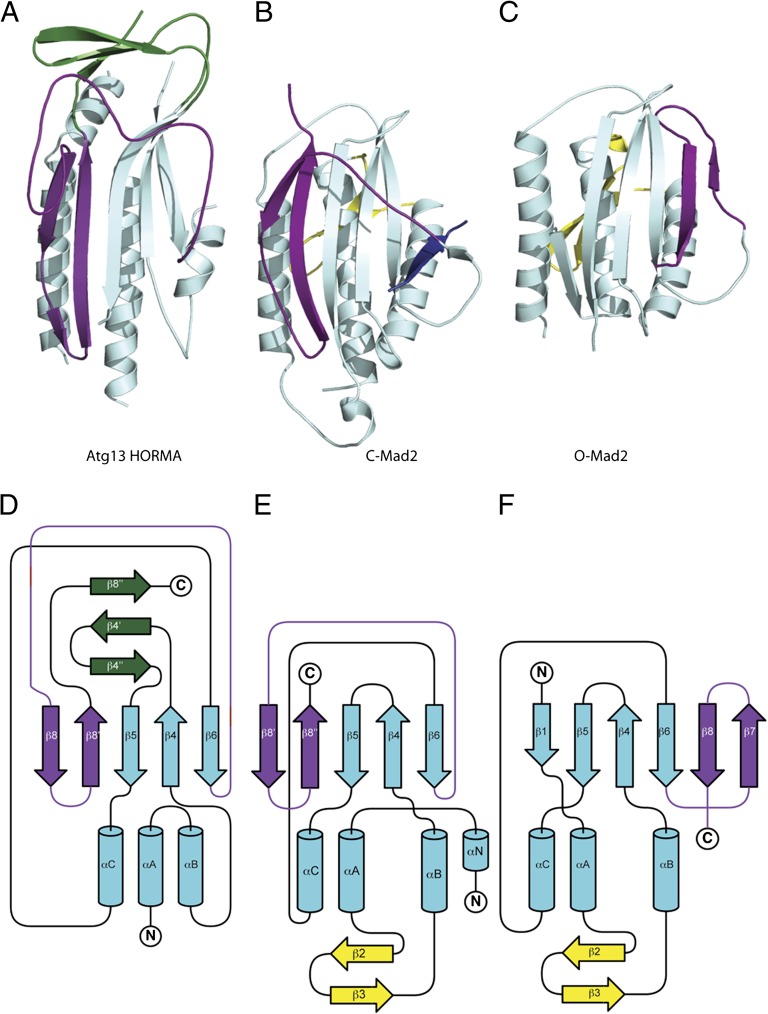
Fig. 4.
Unexpected structural homology between Atg13 and C-Mad2. (A) Ribbon diagram of the HORMA domain of Atg13 colored as is shown in Fig. 3A. (B) Ribbon diagram of the closed state of Mad2 oriented identical to Atg13 in A, with the Mad1 binding peptide shown in dark blue. Regions structurally related to the HORMA domain of Atg13 are colored in cyan except the safety belt region, which is highlighted in purple. Regions unique to Mad2 are colored in yellow. Coordinates taken from Protein Data Bank (PDB) ID 1GO4. (C) Ribbon diagram of the open state of Mad2 oriented identical to Atg13 in A and colored exactly as in B. Coordinates taken from PDB ID 2V64. (D–F) Topology diagrams for the Atg13 HORMA domain (D), closed state of Mad2 (E), and open state of Mad2 (F) colored exactly as in A–C.

