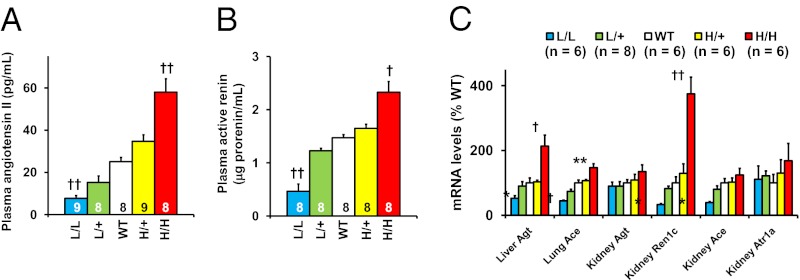
Fig. 4.
Renin–angiotensin–aldosterone system in L/L, L/+, WT, H/+, and H/H male mice at age 12 wk. *P < 0.05, **P < 0.01, †P < 0.001, ††P < 10−4 vs. WT. (A) Angiotensin II levels in the plasma. (B) Active renin concentration in the plasma. (C) Tissue mRNA levels for the components of renin–angiotensin system.

