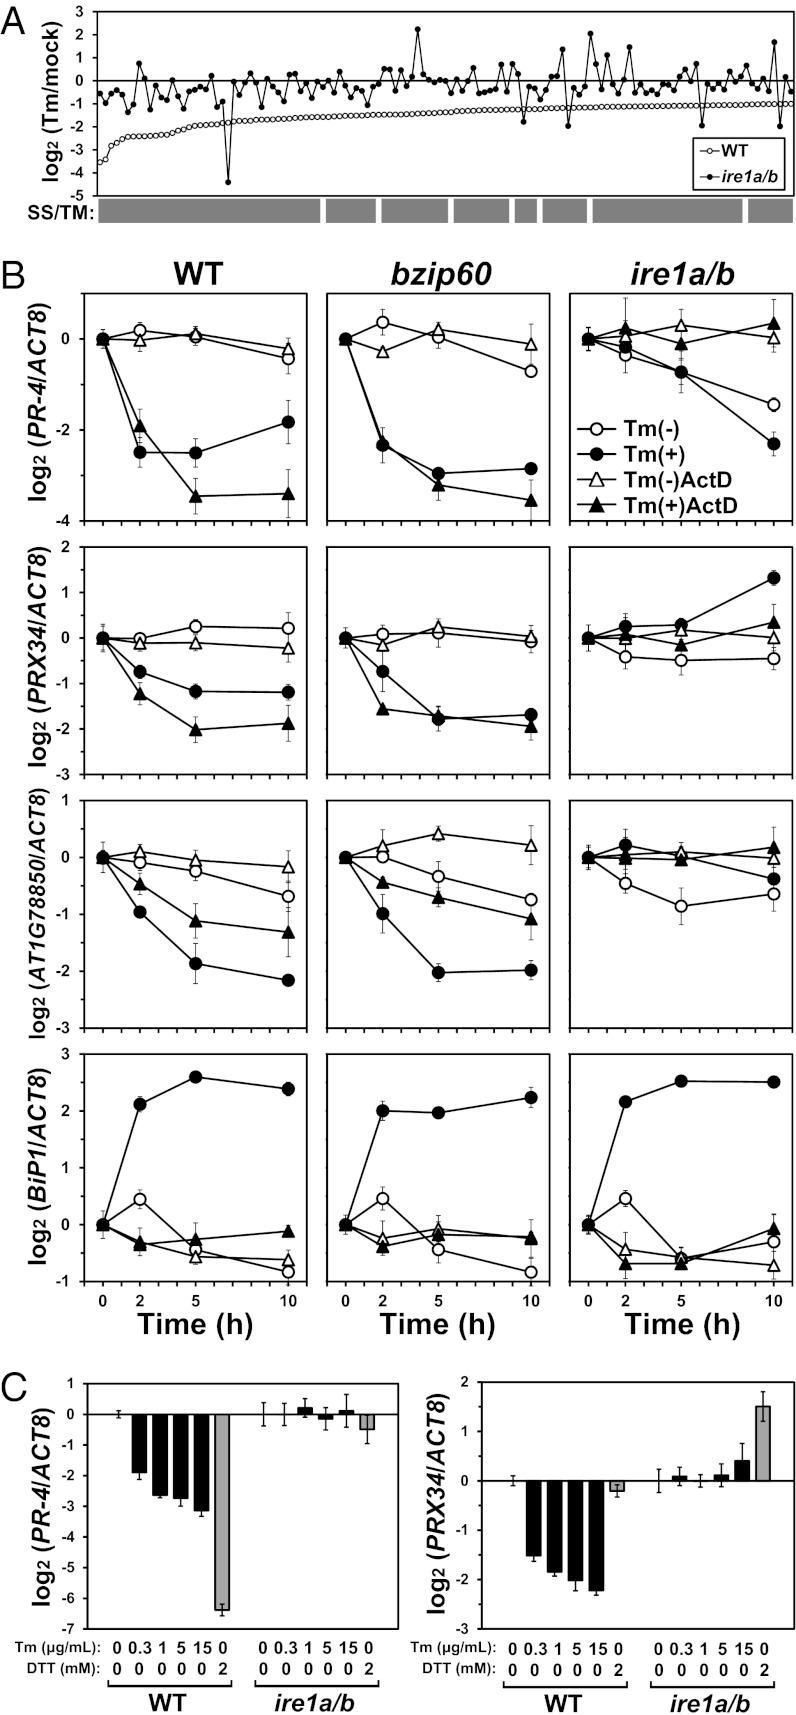
Fig. 2.
IRE1-dependent down-regulation of transcripts by Tm. (A) Transcript level ratios (Tm/mock) of 125 genes considerably down-regulated (log2 < −1) by Tm (5 µg/mL) in WT (open circle) are shown on a log2 scale according to the degree of down-regulation. Ratios in ire1a/b are denoted by filled circles. Genes encoding predicted SS/TM are denoted by the gray bars. See Dataset S1 for detailed information. (B) Relative transcript abundance after Tm treatment of three selected genes and BiP1 as a control as presented on a log2 scale. RNA was prepared from WT, bzip60, and ire1a/b seedlings treated with DMSO (mock; open circle) or Tm (5 µg/mL) (filled circle) for the indicated periods and subjected to qPCR. Seedlings were pretreated with ActD (75 µM) for 2 h before Tm treatment (triangles). (C) The relative transcript abundance of PR-4 and PRX34 as presented on a log2 scale. RNA was prepared from WT and ire1a/b seedlings treated with various concentrations of Tm (black bars) or 2 mM DTT (gray bars) for 5 h and subjected to qPCR. Data are means ± SD of four independent experiments. Data for AT1G78850 are presented in Fig. S4B because of space limitations.

