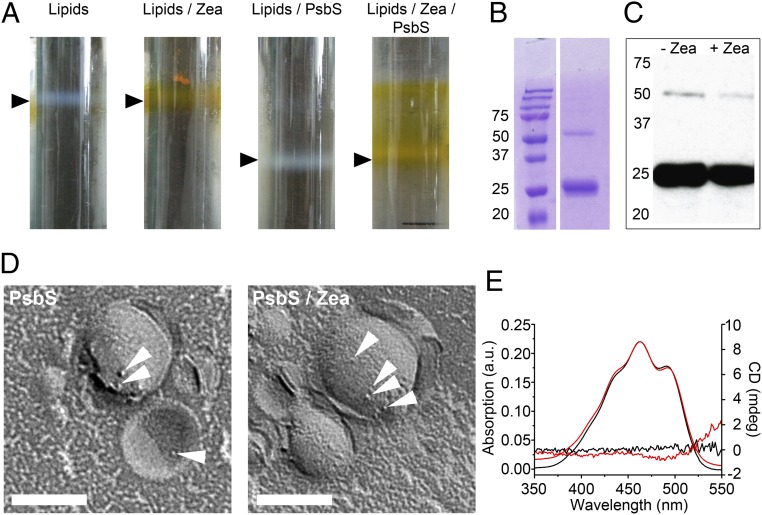
Fig. 1.
Reconstitution of PsbS into thylakoid-like liposomes. (A) Sucrose density gradients of liposomes (black arrowheads). (B) SDS/PAGE of PsbS proteoliposomes shows monomeric (∼26 kDa) and a smaller amount of dimeric (∼52 kDa) PsbS (Left, molecular mass in kilodaltons). (C) Western blot of proteoliposomes containing PsbS ± Zea in the lipid phase with a PsbS antibody. (D) Freeze-fracture electron micrographs of PsbS proteoliposomes. Protein particles are indicated by white arrowheads. (Scale bars: 100 nm.) (E) Absorption and CD difference spectra of liposomes (red, lipids with Zea minus lipids; black, PsbS proteoliposomes with Zea minus PsbS liposomes). Absorption spectra show two maxima at 463 and 491 nm. The absorption spectrum for PsbS/Zea in proteoliposomes was normalized to 463 nm. a.u., arbitrary units; mdeg, millidegrees.

