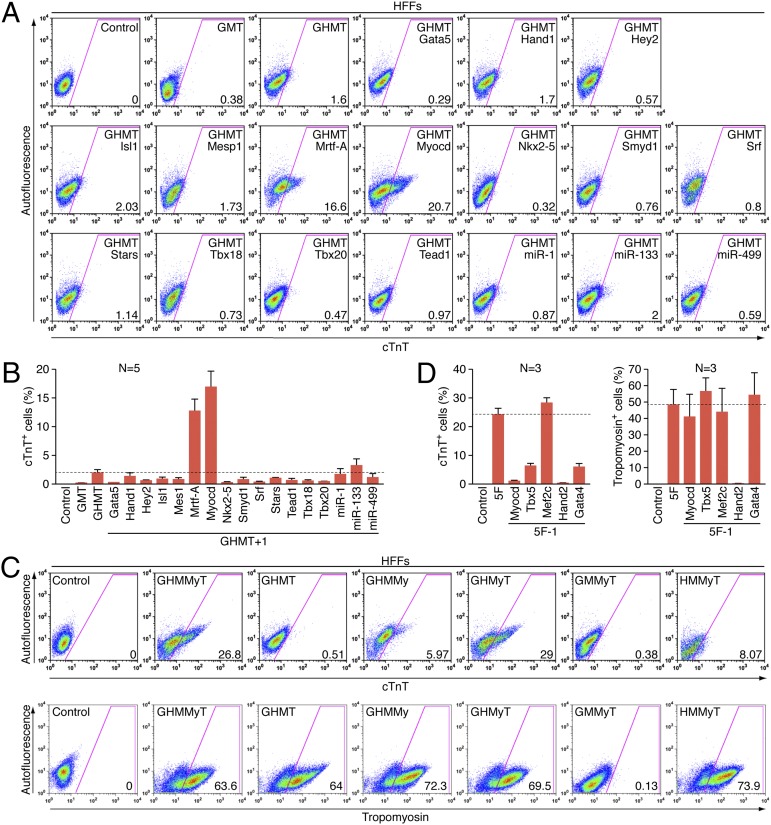
Fig. 1.
Screening for additional factors able to activate cardiac gene expression. (A) Representative flow cytometry plot for analyses of cTnT+ cells 2 wk after infection of HFFs with retroviruses expressing indicated combinations of factors. Cells infected with empty vector retrovirus were used as a control. The numbers in each plot indicate the percentage of cTnT+ cells. (B) Summary of flow cytometry analyses. Percentage of cTnT+ cells following infection of HFFs with empty vector retrovirus (control) or retroviruses expressing GHMT with an indicated individual factor as shown. Data from five independent experiments are presented as mean ± SD. Dotted line indicates the percentage of cTnT+ cells induced by retroviruses expressing GHMT alone. (C) Representative flow cytometry plot for subtractive analyses to determine the requirement of each individual factor in 5F (GHMMyT). Two weeks after infection of HFFs with retroviruses expressing indicated combinations of factors, cTnT+ (Upper) and tropomyosin+ (Lower) cells were quantified by flow cytometry. Cells infected with empty vector retrovirus were used as a control. The numbers in each plot indicate the percentage of cTnT+ or tropomyosin+ cells. (D) Summary of flow cytometry analyses. Percentage of cTnT+ (Left) or tropomyosin+ (Right) cells following infection of HFFs with empty vector retrovirus (control), or retroviruses expressing 5F (GHMMyT) or 5F minus an indicated individual factor as shown. Data from three independent experiments are presented as mean ± SD. Dotted line indicates the percentage of cTnT+ or tropomyosin+ cells induced by retroviruses expressing 5F.

