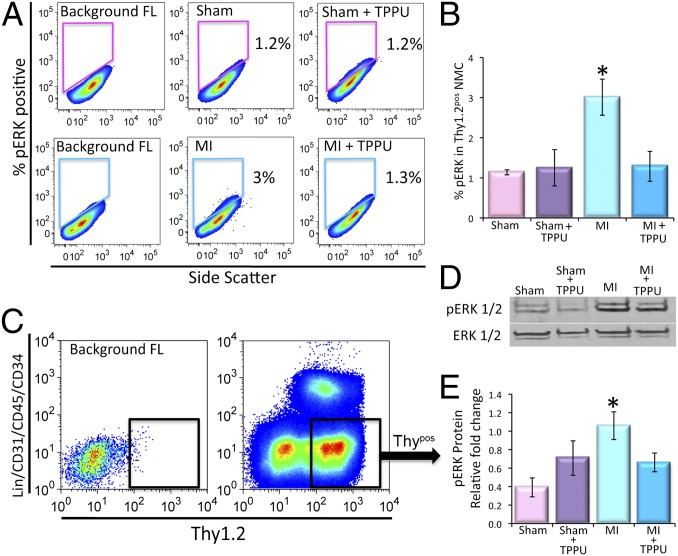
Fig. 4.
Activation of CFs in cardiac fibrosis through the pERK1/2 pathway. (A) Flow cytometric analysis of pERK1/2+ nonmuscle cells from sham-operated, TPPU-treated–sham-operated, MI and TPPU-treated MI mice. (B) Summary data from A (n = 3 per group). (C) Florescent activated cell sorting (FACS) of Thy1.2+/Lin−/CD31−/CD45−/CD34− cells (Thypos). Representative results are shown. (D) Representative lanes of Western blot assay and (E) summary data for pERK1/2 and ERK1/2 (loading control) performed from FACS sorted Thypos cells from sham-operated, TPPU-treated–sham-operated, MI and TPPU-treated MI mice (n = 3). Error bars represent SE and *P < 0.05.

