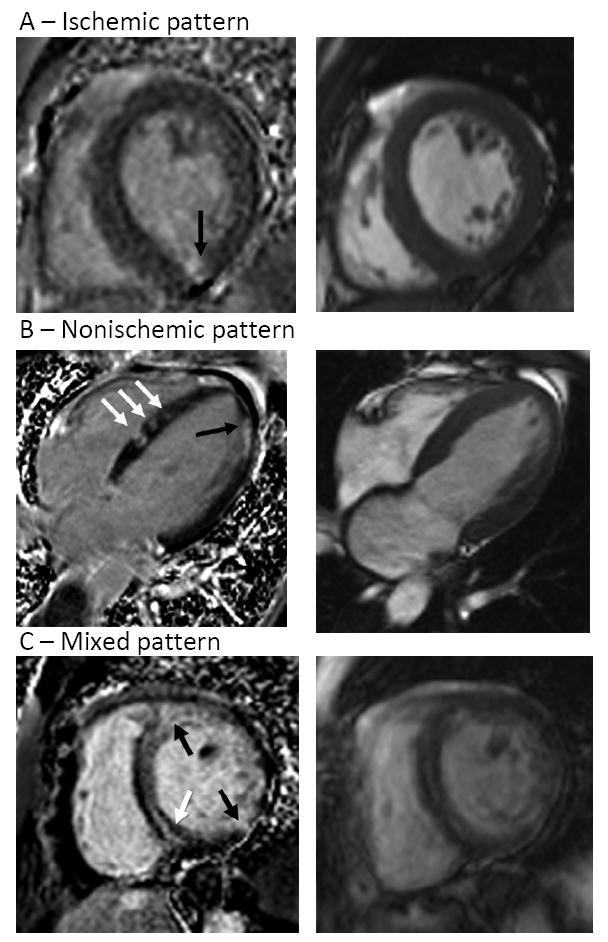
Figure 3.

Representative CMR images showing late gadolinium enhancement (LGE) (left) with corresponding end-diastolic cine image (right)
Panel A: Small, nearly transmural LGE involving the mid inferior wall (arrow).
Panel B: Patchy areas of LGE throughout the left ventricle which are primarily midwall, with some septal areas extending to the right ventricular subendocardium (white arrows) and a nearly transmural area in the apical lateral wall (black arrow).
Panel C: Representative images showing a mixed pattern of LGE: multiple separate areas of enhancement demonstrating midwall (white arrow) and transmural (black arrows) involvement.
