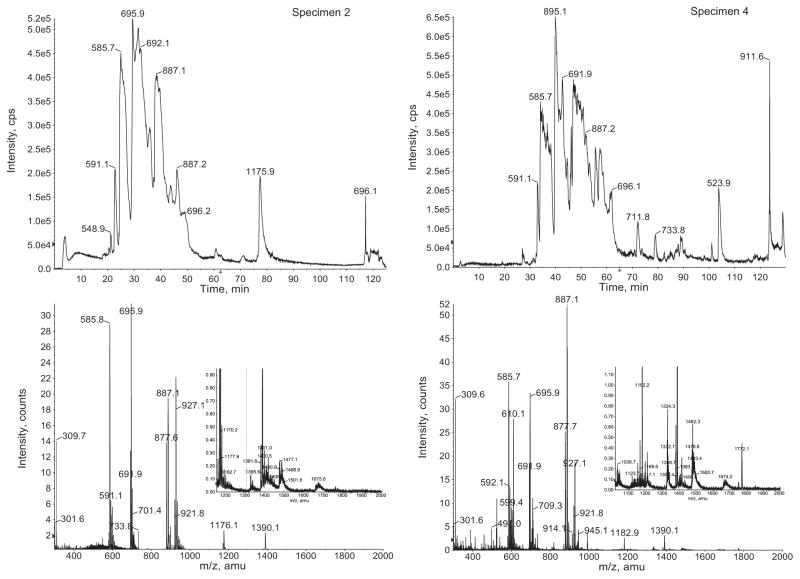
Fig. 5.
NanoLC–ESI-MS total ion chromatograms and mass spectra of the injected venom of C. ermineus. Left: specimen 2. Right: specimen 4. Top: total ion current chromatograms reflecting the relative abundance in counts per second (cps) over time of elution (in minutes). Bottom: ions extracted (m/z) from the chromatogram. A magnified inset is provided for higher m/z values. These spectra were used for the peptide Bayesian reconstruction for the determination of peptide molecular weight distribution within the venom. The numerical labels over the peaks represent the m/z ions of the major components of the venom.

