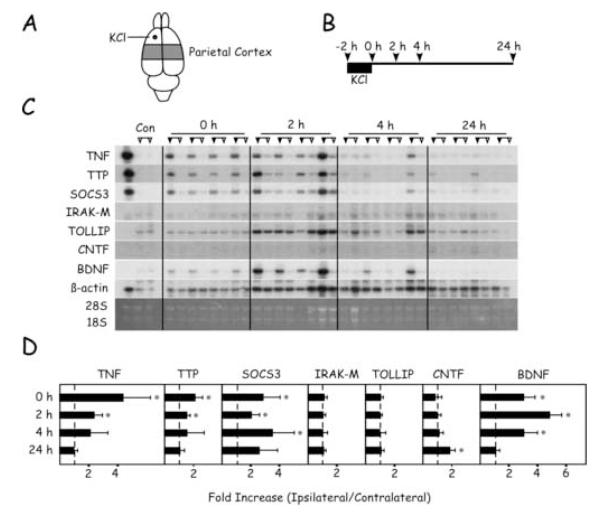
Figure 3.
Timecourse of changes in mRNA levels in the parietal cortex after application of KCl. (A) Region of parietal cortex sampled and location of KCl application. (B) Timecourse of experimental protocol and animal sacrifice for tissue sampling. (C) Northern blots of samples from each of the four animals sacrificed at the different time points. For each animal, samples from the hemisphere ipsilateral to the application site are indicated by the filled triangles; samples from the contralateral hemisphere are indicated by the open triangles. The control lanes are samples from an unoperated control animal. In the far left-hand lane, a positive control sample was generated from activated splenocytes. (D) Quantitation of Northern blots. For each transcript, the ratio of ipsilateral/contralateral level was calculated in each animal. Values are expressed in means ± SD. Asterisks denote significant differences between hemispheres, p < 0.05.

