
Fig. 5.
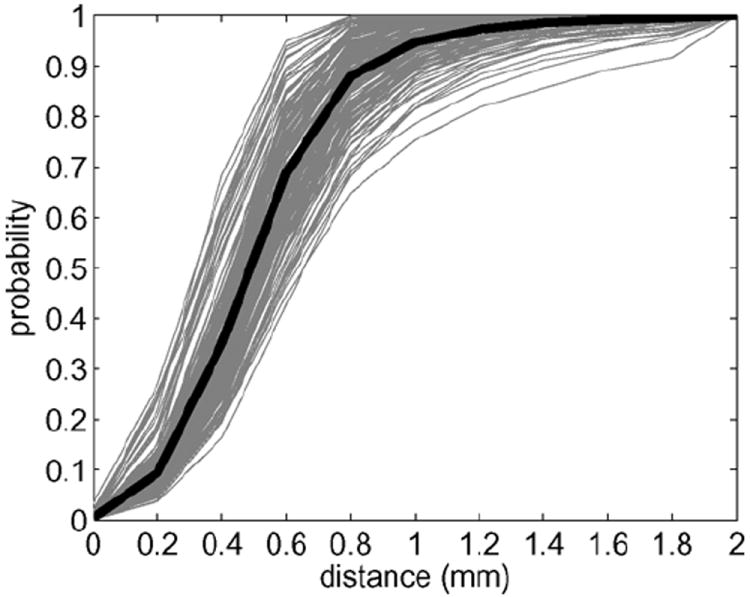
Surface distance graphs are shown to quantify the percentage of vertices on the deformed template surface having the distance to subject’s surface less than d mm. Grey lines are the surface distance graphs of individual hippocampal surfaces. Black line represents the surface distance graph averaged among all 166 hippocampal surfaces.