
Fig. 6.
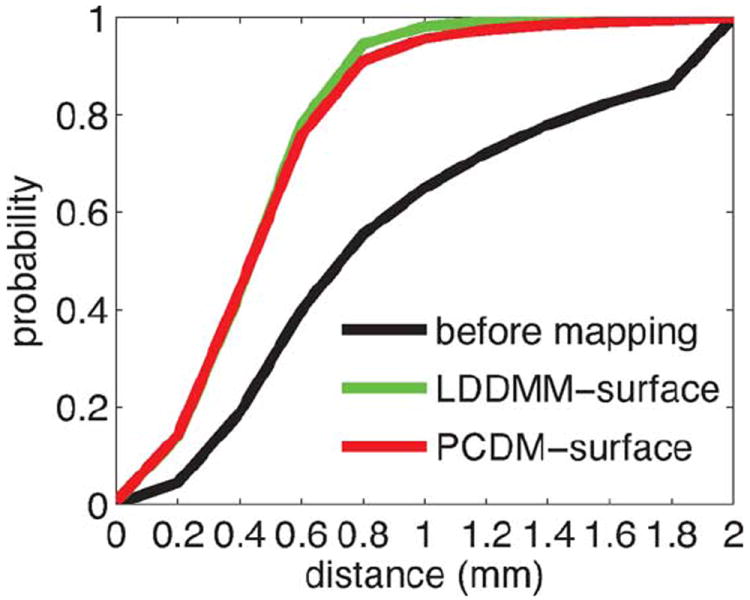
Surface distance graphs are shown to quantify the percentage of vertices on the deformed template surface having the distance to subject’s surface less than d mm. Black, green, and red curves are the average surface distance graphs across 10 Alzheimer’s disease patients before and after the LDDMM-surface and PCDM mappings, respectively.