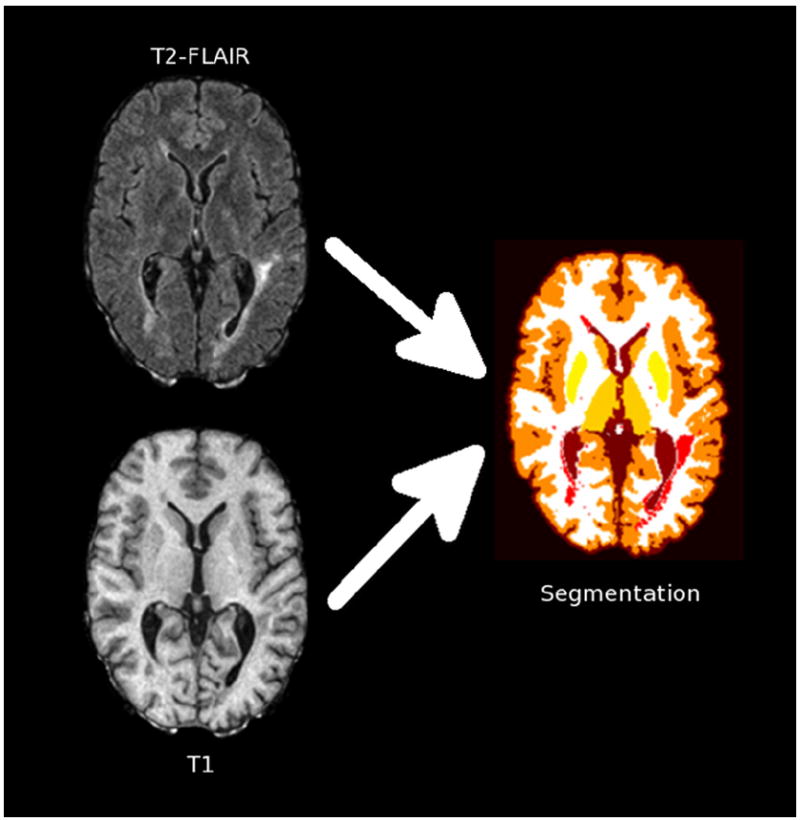
Fig. 2.

Schematic depiction of the segmentation process, which uses T2-FLAIR and T1-weighted images to derive tissue segmentation including lesions (red), cerebral white matter (white), cerebral cortex (dark orange), caudate (light orange), putamen (light yellow), thalamus (dark yellow), and ventricles (brown). (For interpretation of the references to color in this figure legend, the reader is referred to the web version of this article.)
