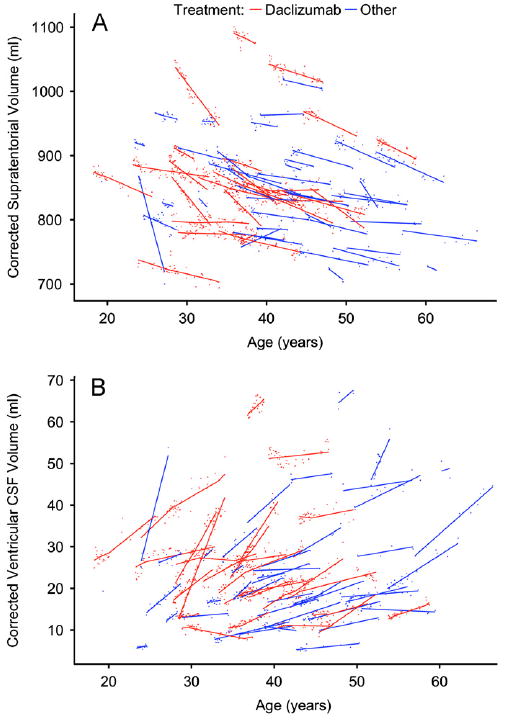
Fig. 3.

Supratentorial brain volume (A, small points) and ventricular volume (B, small points), with corresponding model fits (solid lines), for each participant. In both, a change in slope can be seen in the daclizumab cases (red points and lines), beginning 90 days after initiation of therapy and ending 90 days after cessation. Data points are corrected for differences relating to acquisition protocols, as described in Section 2.
